What's Under Your Skis: How We Simulate the Snowpack for Every Spot
The science, the data and the full winter of testing behind the Snowpack tab, explained for people who ski rather than people who do physics.
Layers, dated
Every avalanche forecast is, underneath, a story about layers. A storm lays down snow. A clear, cold week turns the surface weak and sugary. Feathery frost grows on a calm night and gets buried by the next storm. A warm spell or a rain event leaves a crust. Months later, one of those layers is what a slab slides on.
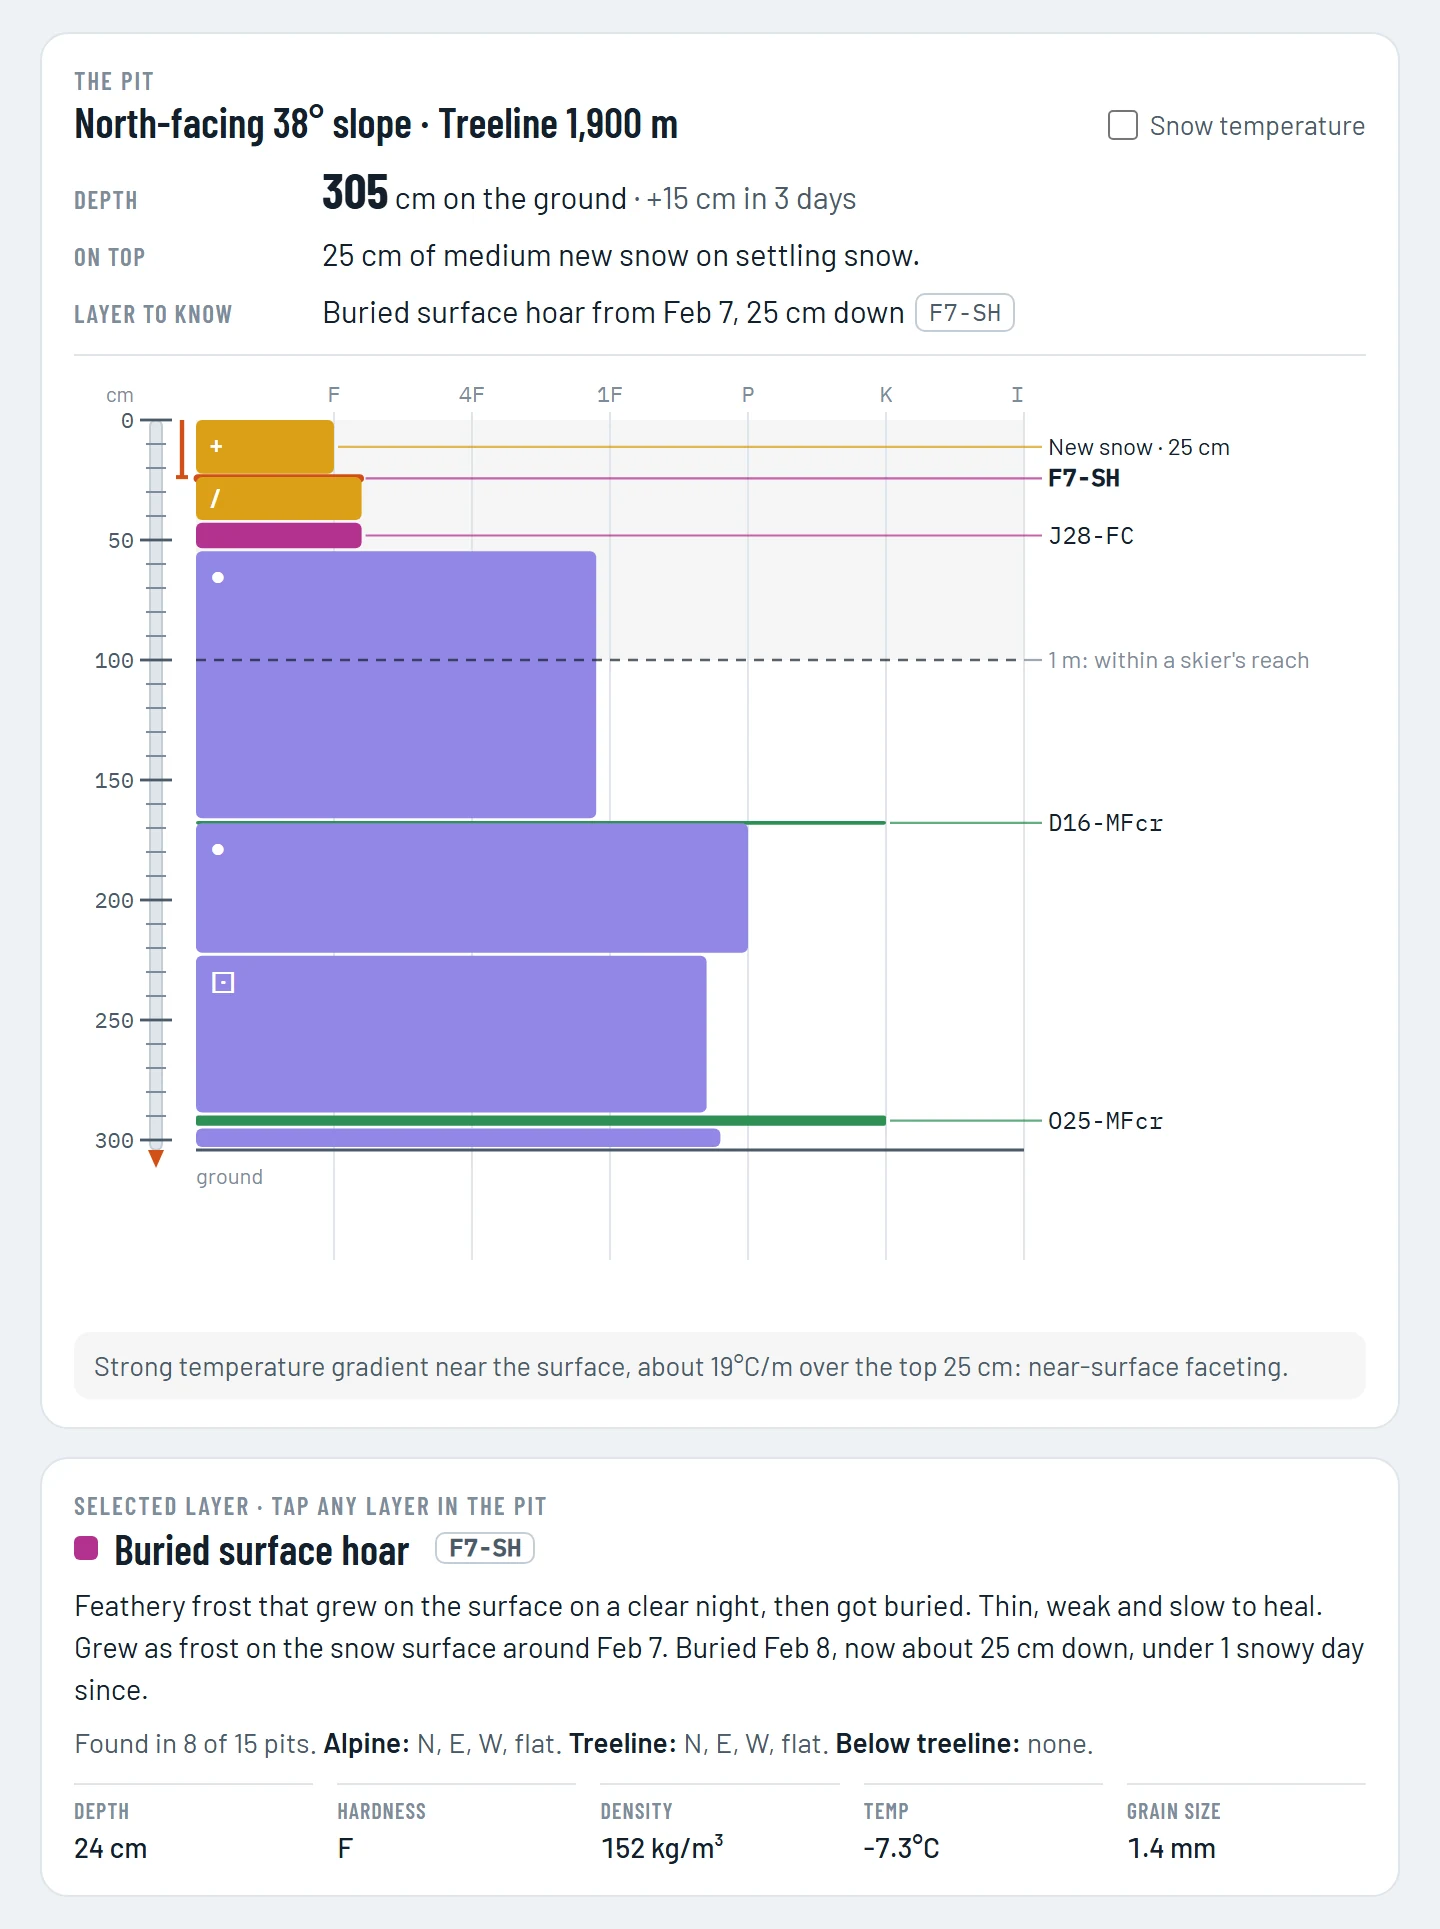
The Snowpack tab gives every resort, cabin and saved zone in Snow Doctor a simulated snow pit: the whole season, layer by layer, each layer dated the way forecasters name them. This post explains the science behind it, the data that feeds it, and the winter of testing it went through before we trusted it.
The model: SNOWPACK, research-backed
We didn't write our own snow physics. We use SNOWPACK, developed since the 1990s by the WSL Institute for Snow and Avalanche Research SLF in Davos, Switzerland. Its physics is described in peer-reviewed research (listed at the end of this post), it runs operationally for the Swiss avalanche warning service, and Avalanche Canada publishes simulated snow profiles from it on its public snowpack tool.
SNOWPACK follows a single column of snow, from the ground to the surface, split into about a hundred thin layers. Every 15 minutes it takes in the weather and updates each layer:
- Settling. New snow compacts and strengthens under its own weight and the weight of later storms.
- Temperature. Heat moves through the snow. A strong temperature difference across it turns grains into angular, poorly bonded facets, the "sugary" snow forecasters watch for.
- Frost. On calm, clear nights, surface hoar (feathery frost) grows on the surface. Buried, it's one of the most persistent weak layers there is.
- Melt and refreeze. Sun, warm air and rain wet the surface, which refreezes into a crust.
- Crystal type and hardness for every layer, using the international snow classification, the same scheme you'd record in a pit.
A full winter is about 23,000 of those 15-minute steps, which our server works through in roughly 11 seconds for one column. We run SLF's program unmodified. Everything we tuned is either a setting SLF documents or the weather we feed it; the physics is theirs.
The weather behind it
SNOWPACK needs the weather hour by hour, from the start of the season: temperature, humidity, wind, sunshine, cloud, precipitation, and the temperature higher in the atmosphere. We use HRDPS, the High Resolution Deterministic Prediction System from Environment and Climate Change Canada, which covers the country in squares 2.5 km across, delivered through Open-Meteo.
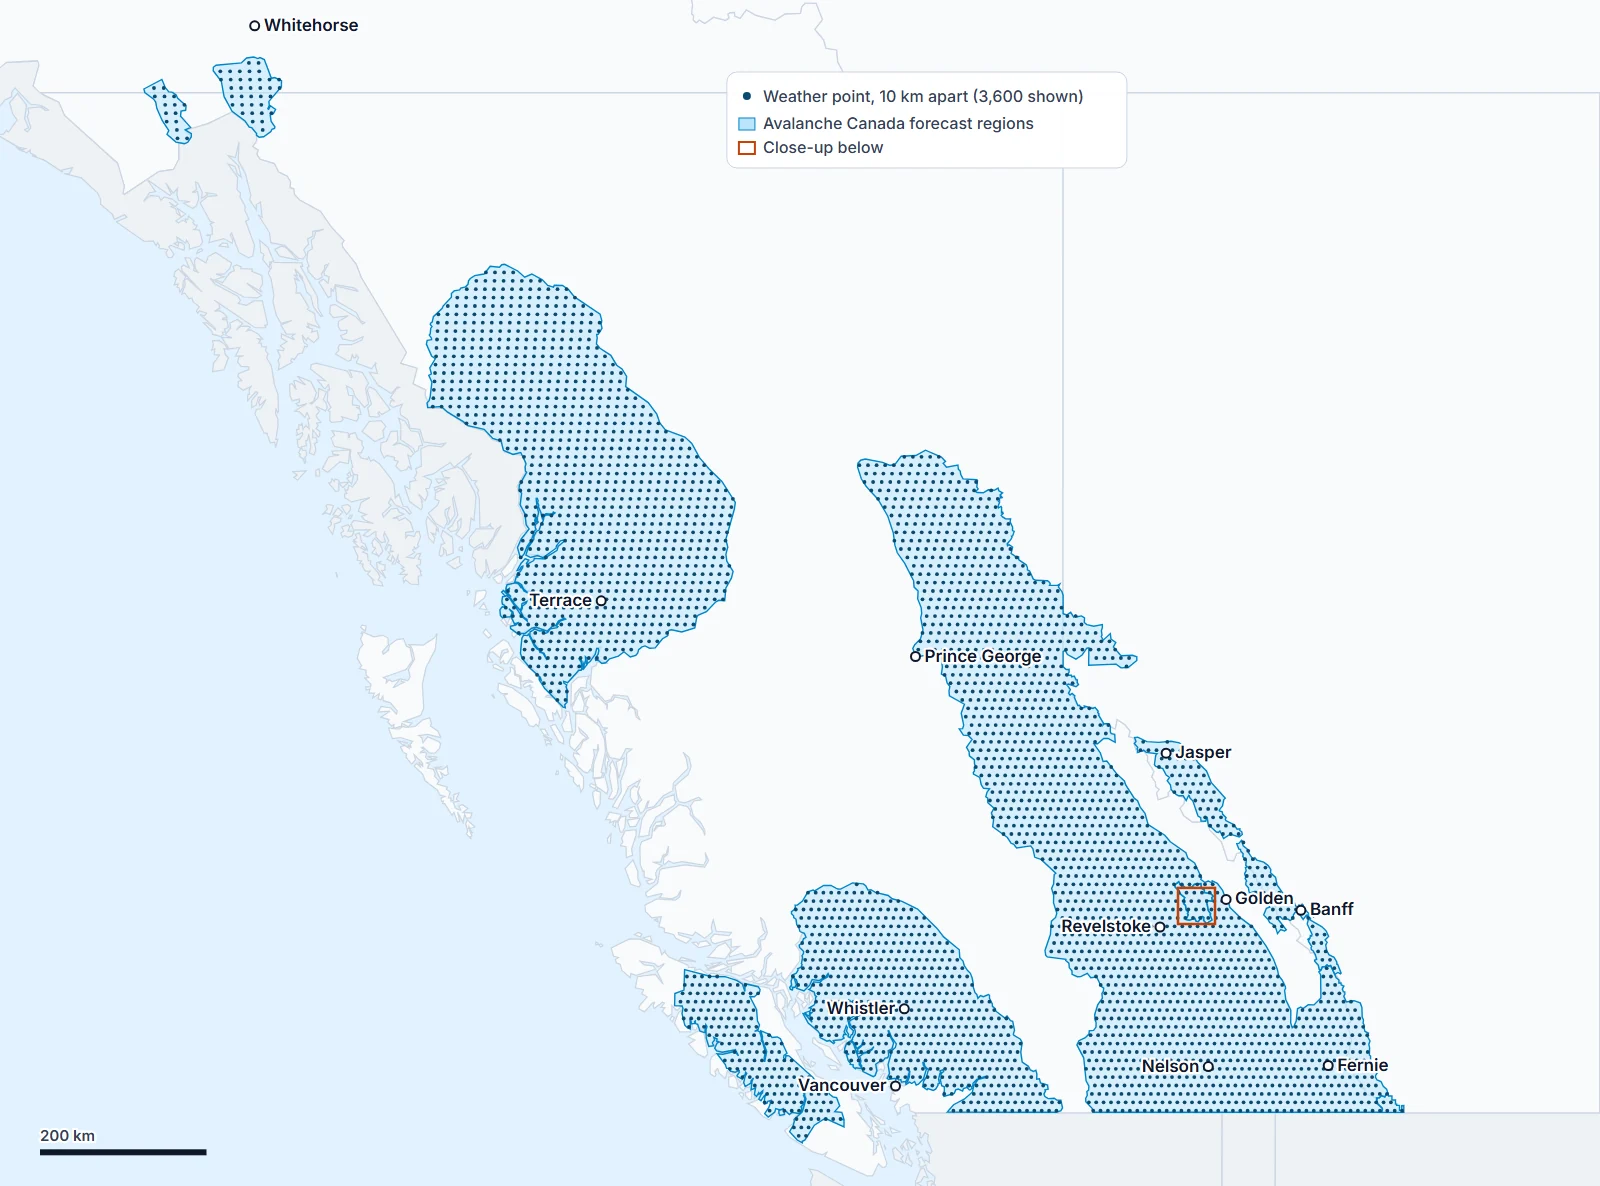
Snow Doctor keeps the whole season's weather for a grid of about 3,800 points spaced 10 km apart, covering every Avalanche Canada forecast region: about 380,000 square kilometres, an area larger than Germany. Each point is saved at three heights set for its region, from its lower terrain to its upper, so the archive holds about 11,500 weather records for every hour of the winter.
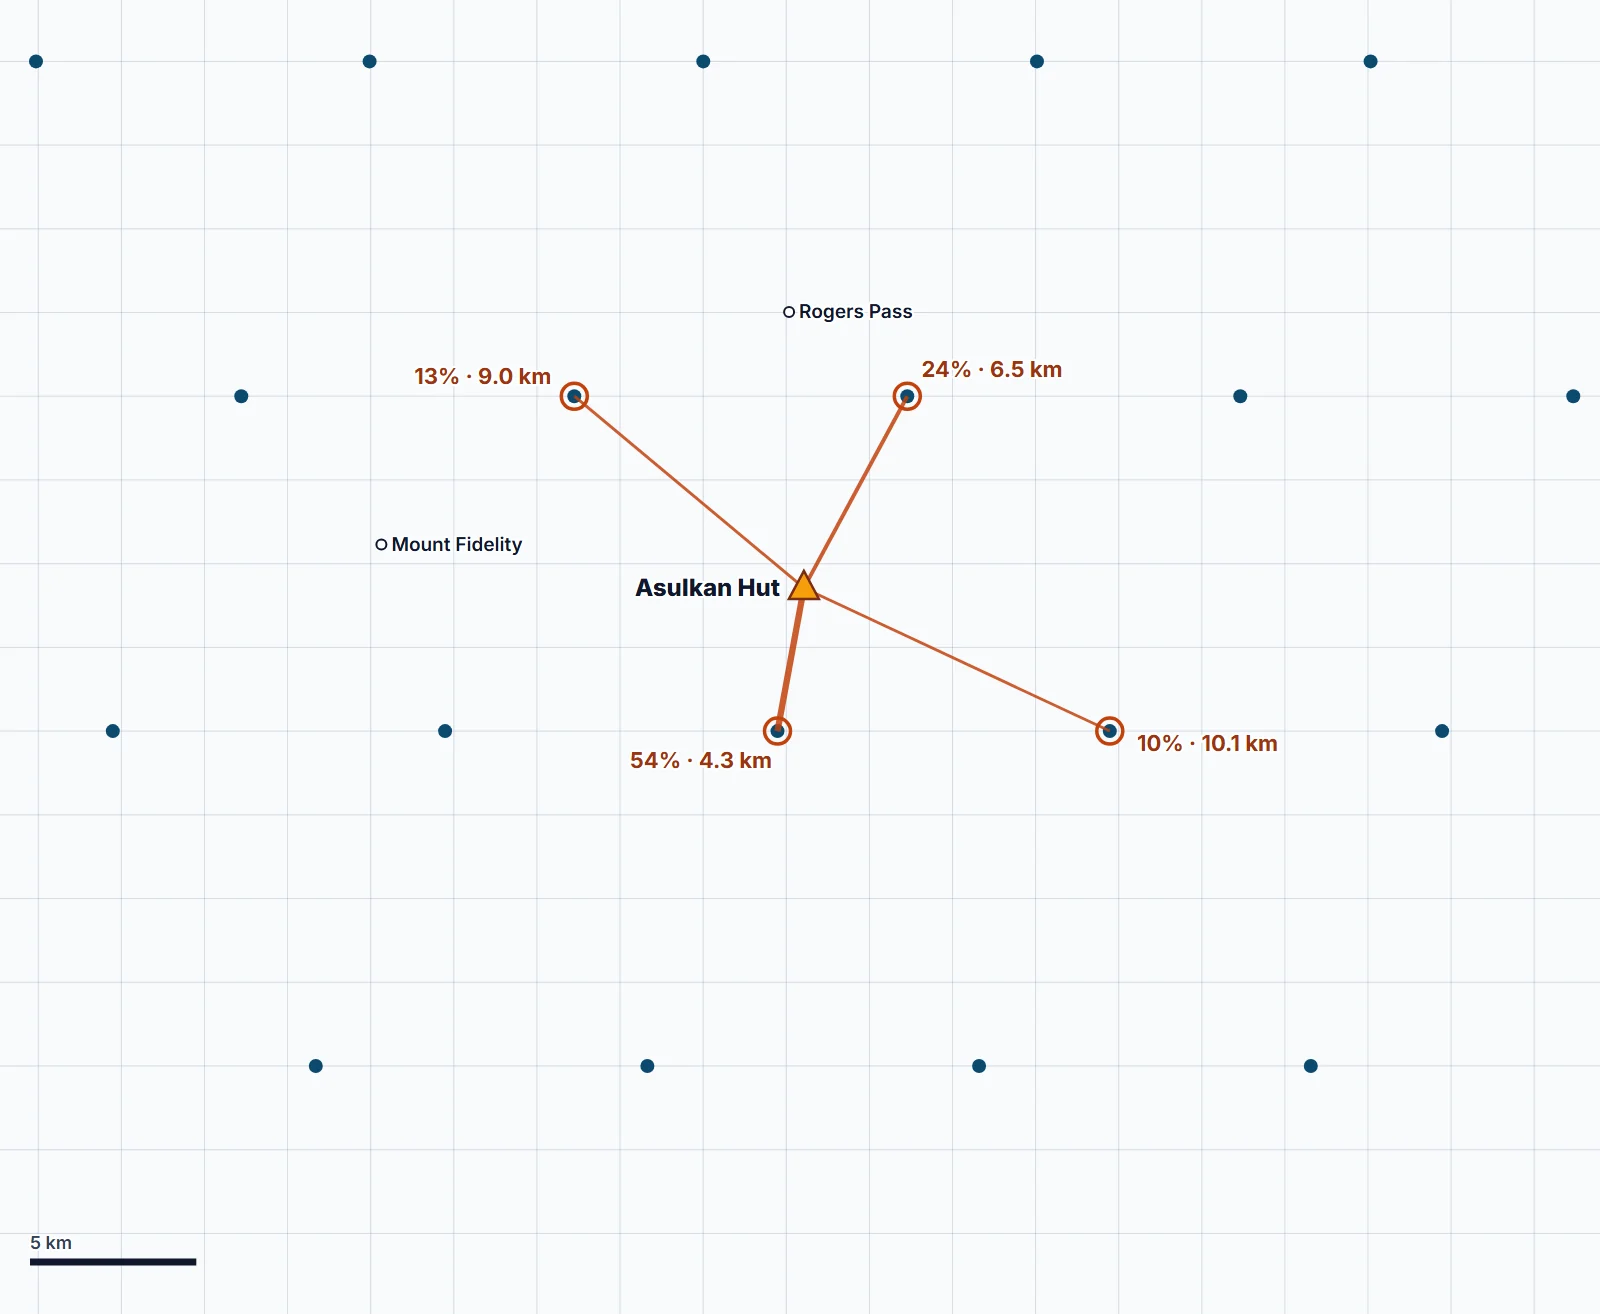
For any spot on the map, the weather comes from the four grid points around it, the nearest always within about 7 km, adjusted to the spot's exact height and blended so the closest points count most. Every simulated season starts on October 1 from bare ground, so a zone you create in January still gets its full season.
How we tested it
We replayed the whole of last winter, October 1, 2025 to May 31, 2026, and measured the simulations against three independent references. In all, that meant 145 full-season simulations at 22 locations, 61 of them on flat ground plus four slope aspects, testing more than 20 combinations of model settings and weather inputs.
The references
- Avalanche Canada's bulletins. 23 Glacier National Park bulletins, one a week from November to April. They name the important weak layers and crusts by date and elevation. We simulated Mount Fidelity (1,905 m) and Asulkan Hut at two elevations near Rogers Pass, and checked every named layer: 5 weak layers and 35 crust cases across elevations and slopes.
- Avalanche Canada's own simulations. Their public snowpack tool shows simulated profiles across the province. We read 18 profile dates at 7 locations spanning four snow climates, recording total depth and every layer they labelled, 70 layer observations in all, and ran our simulation at the same place and height:
- Coast: Brohm Ridge (1,658 m) and Whistler (1,836 m)
- Columbia Mountains: Mount Fidelity (2,005 m) and Quartz Creek (2,168 m)
- Kootenays: Kokanee (2,232 m) and Gray Creek (2,179 m)
- Rockies: Mount Whymper (2,516 m)
- Measured snow. The BC River Forecast Centre's automated snow stations weigh the snow on a "snow pillow" all winter. We used 85 of them, from the North Shore to the Rockies, to check the weather model's snowfall, and ran full-season simulations at 9 of them across every snow climate.
The rules
Every variant was scored by the same written rules, so each change was judged on the same test. A bulletin layer counted as found only if the simulation formed a weak layer within 4 days of the named date, with at least 5 cm of stronger snow on top. A crust counted only if it sat within 5 cm of where the snow surface was when the crust formed. An Avalanche Canada layer counted only if ours was of the same family (weak layer or crust) and laid down within 4 days. When we refined a rule, for example after learning that Avalanche Canada dates a layer by the day it was buried, we re-scored every earlier variant under the new rule. A change was kept only if it improved what it targeted without a meaningful loss anywhere else, and every variant, kept or rejected, is recorded in our calibration log.
What the testing changed
- Night-time cooling. With SNOWPACK's default settings, our simulated snow surface cooled too much on clear nights: the lower snowpack turned mostly to facets where Avalanche Canada's profiles showed it settled, and buried surface hoar never formed. The weather data doesn't include the heat radiated down from the sky, so SNOWPACK estimates it, and the standard estimate ran cold. A recognised clear-sky formula (Prata, 1996), a small calibrated offset, and SLF's documented neutral setting for how air and snow exchange heat corrected it. All five named weak layers then appeared on the right dates.
- Rain or snow at treeline. The model initially missed 12 of 22 treeline crusts the bulletins named. In warm storms the surface temperature it was given put the rain line too low. We now decide rain or snow from HRDPS's own temperatures higher in the atmosphere, read at the spot's height. Treeline crusts missed entirely fell to 5, and after the later changes, one crust in the whole test was missed outright.
- Sun crusts. SNOWPACK's default snow reflectivity barely ages, so sunny south slopes reflected about 90% of the sunlight even after a dry week, and never crusted. SLF's alternative reflectivity model (Schmucki et al., 2014) lets older snow darken as real snow does, and the late-January and February sun crusts appeared at both treeline sites.
- Weather at mountain heights. The grid points often sit in valleys. Saving each point at its region's three heights, rather than at the valley floor, gives every spot the extra snowfall that high ground gets.
- Blending. Combining four points slightly smooths out the extra snow a spot gets from its own terrain. Across the 85 snow stations, measured snow was 1.14 times the blended weather against 1.04 times each station's own weather square, so blended precipitation is raised by 10%, bringing it in line.
The results
| Check | Result |
|---|---|
| Weak layers named in the Glacier bulletins | 5 of 5, on the right dates |
| Crusts named in the Glacier bulletins (35 cases) | 27 found as crusts, 7 more flagged as a weak layer at that spot, 1 missed |
| Layers Avalanche Canada labelled (70 observations) | 61 present on the right dates |
| Crystal type of those layers | About half an exact match; where we differ, ours has usually started to round a little sooner |
| Rockies (Mount Whymper) | Every labelled layer matched, crystal type included |
| Snow depth vs Avalanche Canada's simulations | Typically about 10% shallower than theirs, using the same blended weather every spot in the app uses |
Snow amounts: a lesson in humility
The snow stations showed that the weather model gets the winter's snowfall about right on average, but at any single spot it's typically off by about 25%, and sometimes by a factor of two. We tested whether nearby stations could correct that, holding each station out in turn and predicting it from its neighbours. They can't: two stations 25 km apart disagree with the model about as much as two stations 200 km apart. The errors are local, so we didn't ship a correction.
What every spot does share is the timing of storms. Layer dates are far more reliable than amounts, so the Snowpack tab leads with "a weak layer buried around February 7, about 40 cm down" and rounds every depth to 5 cm.
What it can't see
- Wind at the scale of your slope. The model simulates flat ground and four 38-degree slopes facing north, east, south and west. It knows roughly which slopes face the wind, not the cross-loaded gully or the cornice above your line.
- Local variation. One simulated column stands for an area. Real snowpacks change from one tree well to the next.
- Storms the weather model got wrong. If HRDPS missed rain at your elevation, the simulation misses the crust.
- A sun crust on very cold, clear days. One that formed right around the winter solstice is still missed.
- Heavy spring rain on deep coastal snowpacks. On the Coast, a large March rainstorm soaks our simulated snowpack deeper than Avalanche Canada's.
None of this replaces the avalanche forecast, field observations or a pit you dig yourself. The Snowpack tab describes how the season has built up at a spot. It doesn't tell you whether to go.
How it runs in the app
Open a resort, cabin or zone and Snow Doctor builds that spot's season from October 1 to this morning. After that first time, each day only adds that day's weather. The tab opens in a Simple view, with plain-language layers and dates; its menu switches to a Detailed view with hand hardness, crystal types and layer names in forecaster style, like F7-SH for surface hoar from February 7. Before the snow arrives, the tab can also replay last winter at Asulkan Hut, so you can watch a whole season build up layer by layer.
Forecast regions: one average, and five points on their own
Each Avalanche Canada forecast region has a Snowpack tab too, at three heights set for that region. A region covers thousands of square kilometres, so no single weather point can stand for it. Snow Doctor splits the region's grid points into up to five neighbourhoods and picks one point to represent each: the one whose ground sits closest to the region's middle height, so the samples sit on mountain ground rather than valley floors. Each point counts for its neighbourhood's share of the region, and a corner under 5% of it is left out.
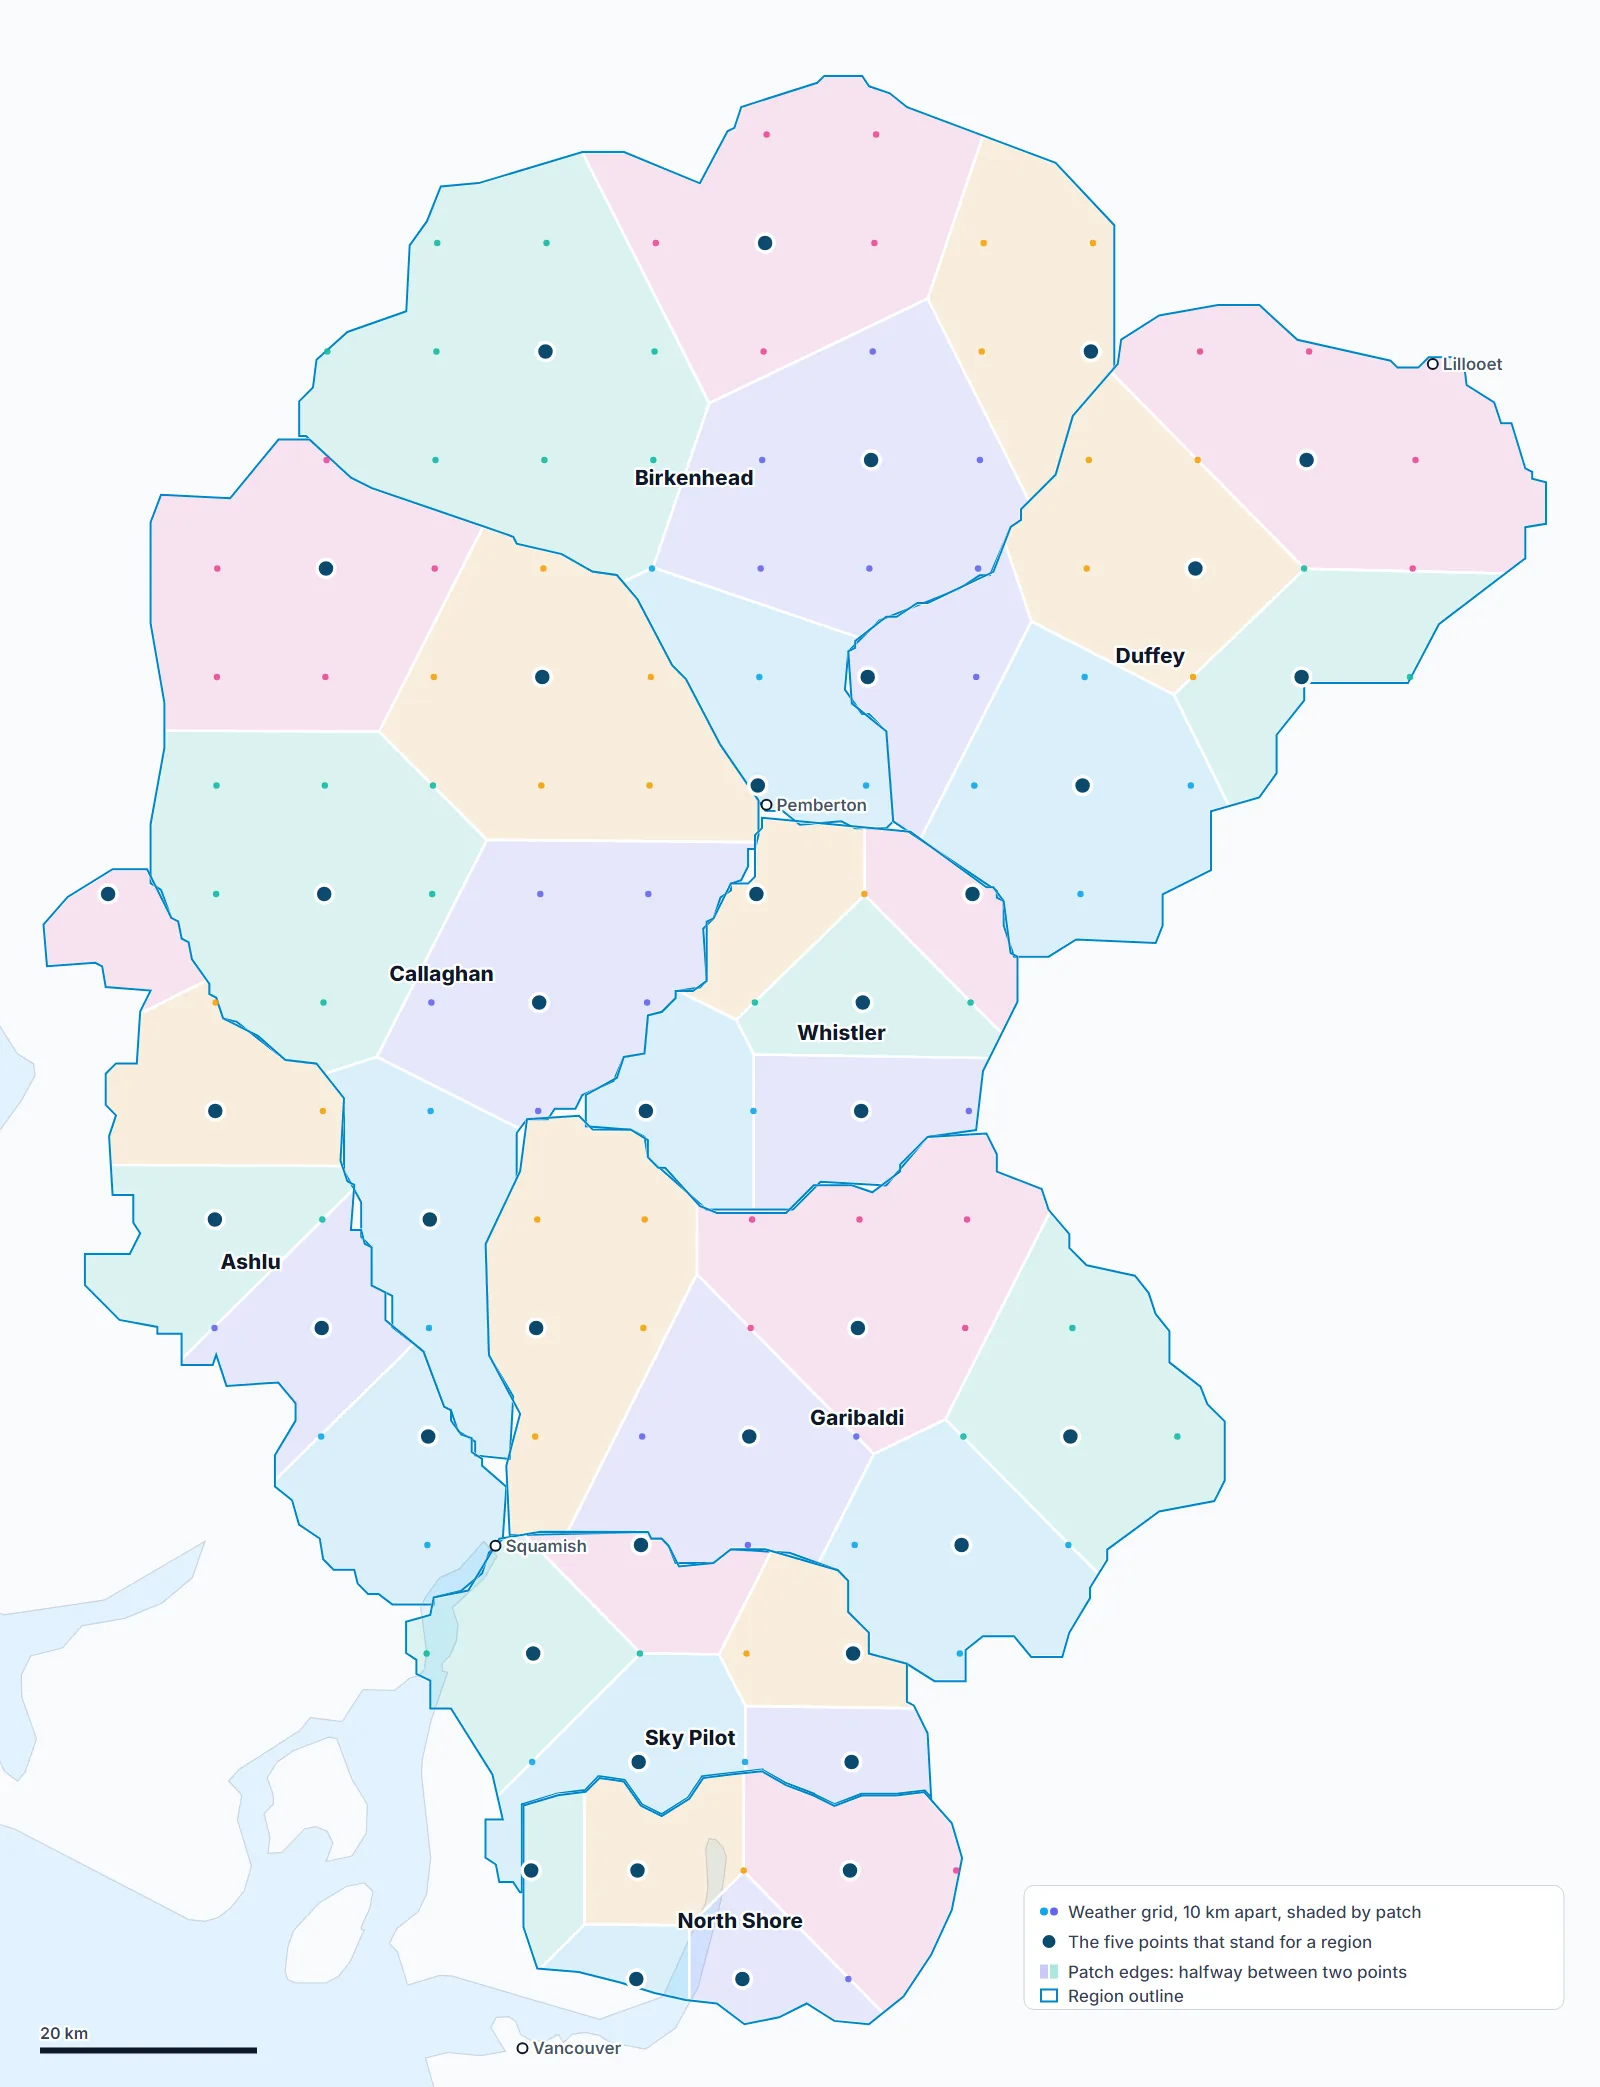
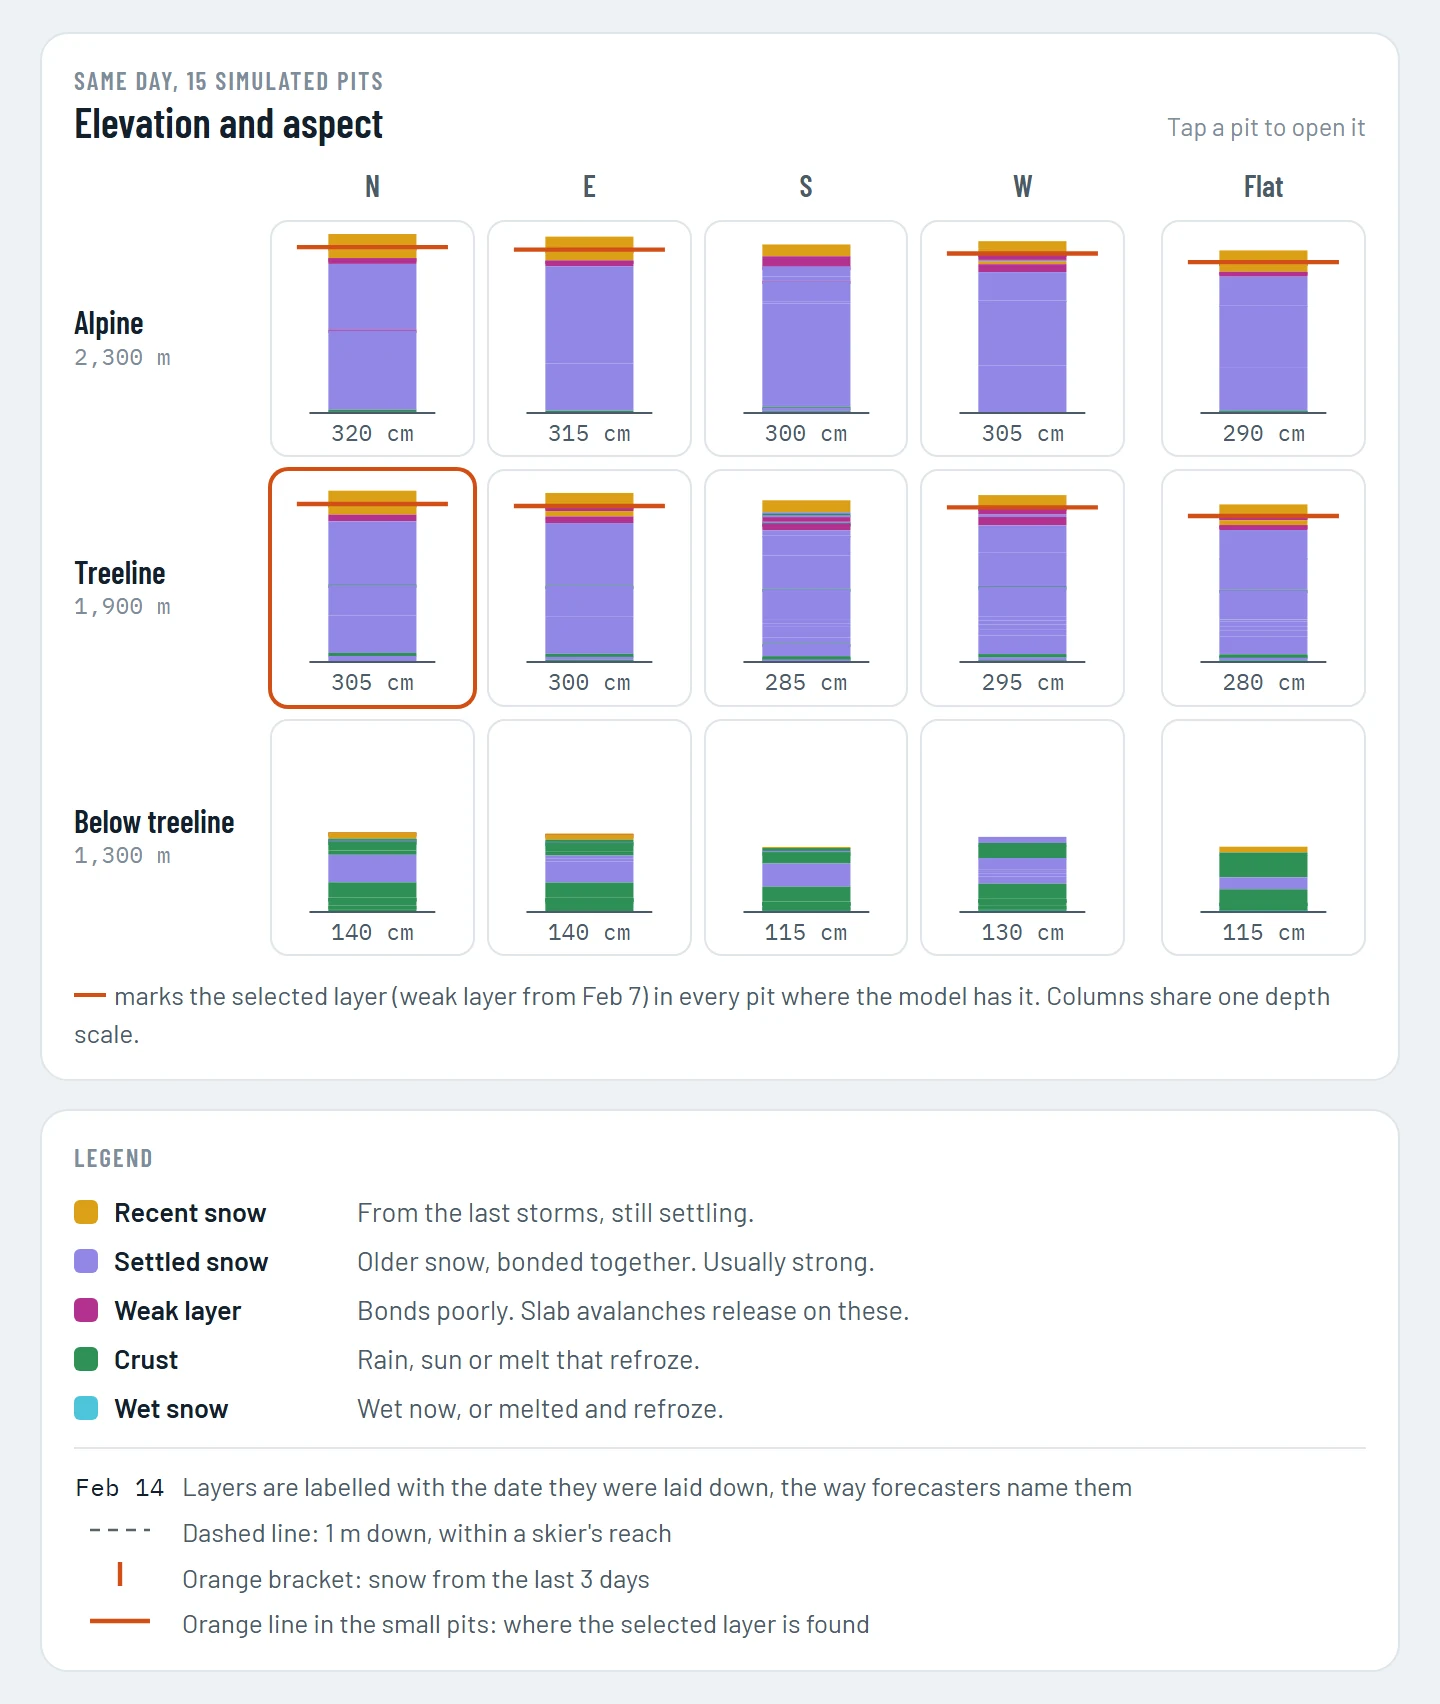
The region's main pit is simulated from those five points' weather, averaged together, on flat ground and four 38° slopes like a resort's. Then each point is simulated on its own, on flat ground at all three heights, from the weather already downloaded for the average, so it costs nothing extra.
That second step is what makes a region's pit worth trusting. Averaging the weather smooths it: a storm or a clear, cold spell that hit one corner of the region comes out milder in the average, and a weak layer that formed only there can blur or vanish from the main pit. The five separate pits show whether a layer is region-wide or patchy.
- Simple view gives the depth as a range across the points ("300 to 325 cm of snow"), and says which points hold each buried layer ("At points 1, 2, 3 and 4 of 5").
- Detailed view draws the five pits side by side under the map, numbered west to east like its pins, with the layer you tapped outlined in each.
- Doctor's Orders reads the same counts, so the report can say a layer turned up at four of five points rather than everywhere.
We average the weather, never the pits. Averaging a pit with buried frost 40 cm down and one without would give a pit that exists nowhere, so the points are counted instead. Like any spot, a region is simulated only when someone opens it: the averaged pit shows first, and the five points fill in after it.
Further reading
- Bartelt, P., and M. Lehning (2002). A physical SNOWPACK model for the Swiss avalanche warning. Part I: numerical model. Cold Regions Science and Technology 35(3), 123-145.
- Lehning, M., P. Bartelt, B. Brown, C. Fierz and P. Satyawali (2002). A physical SNOWPACK model for the Swiss avalanche warning. Part II: snow microstructure. Cold Regions Science and Technology 35(3), 147-167.
- Lehning, M., P. Bartelt, B. Brown and C. Fierz (2002). A physical SNOWPACK model for the Swiss avalanche warning. Part III: meteorological forcing, thin layer formation and evaluation. Cold Regions Science and Technology 35(3), 169-184.
- Fierz, C., et al. (2009). The International Classification for Seasonal Snow on the Ground. UNESCO-IHP, IACS Contribution No. 1.
- Schmucki, E., C. Marty, C. Fierz and M. Lehning (2014). Evaluation of modelled snow depth and snow water equivalent at three contrasting sites in Switzerland using SNOWPACK simulations driven by different meteorological data input. Cold Regions Science and Technology 99, 27-37.
- Prata, A. J. (1996). A new long-wave formula for estimating downward clear-sky radiation at the surface. Quarterly Journal of the Royal Meteorological Society 122, 1127-1151.
- Milbrandt, J. A., et al. (2016). The Pan-Canadian High Resolution (2.5 km) Deterministic Prediction System. Weather and Forecasting 31, 1791-1816.
Credits
- SNOWPACK by the WSL Institute for Snow and Avalanche Research SLF, Davos, used unmodified under its open-source licence (LGPL).
- HRDPS weather from Environment and Climate Change Canada, via Open-Meteo. Contains information licensed under the Data Server End-use Licence of Environment and Climate Change Canada.
- Snow station data from the BC River Forecast Centre's automated snow weather stations. Contains information licensed under the Open Government Licence - British Columbia.
- Avalanche Canada's bulletins and public snowpack tool, used as references to test against. The comparisons, and any errors, are ours.
Forecasters, guides and avalanche professionals: we'd value your eyes on the simulated profiles this winter, and on where they look off. Write to hello@snowdoctor.ca.
Go ski good snow.