Snow Doctor combines avalanche forecasts, 5-model weather data, field observations and a simulated snowpack into a single briefing for every zone in BC and the Canadian Rockies. Everything you need to plan a backcountry day, in one place instead of five browser tabs.
Planning a backcountry day in BC means juggling four or five browser tabs. The avalanche forecast is on avalanche.ca. Weather models are on SpotWx. Field observations are on MIN. Your zones are either in your head or in your route planning app. None of them talk to each other, and none of them tell you what it all means for the terrain you actually want to ride.
The specific aspects, elevation bands, and ATES ratings of the zones you're weighing. Context that turns a generic forecast into a relevant one for the terrain you actually ride.
Tells you the danger rating and which problems are active. Doesn't tell you the weather context that created them, or what happened this past week to set the stage.
Show you raw data for any point you drop a pin on. Don't tell you what any of it means for snowpack stability, wet-slide risk, or travel conditions.
Give you ground truth from people who were there. Scattered, unweighted, and requiring interpretation to understand what they mean for your objective.
Snow Doctor solves the synthesis problem. All four sources, interpreted for the specific terrain you actually ride. Pick a past date, up to 30 days back, and the bulletin, weather, field reports and snowpack all show that day.
Which range got the snow? Where did it fall as rain? Which forecast is even worth opening? The Snow Doctor homepage answers that for every BC and Canadian Rockies region at once, for today, tomorrow or the day after. Colour the map four ways:
Snow and freezing level come straight from Environment Canada's weather models, so they follow the mountains, not the region lines. Tap a region for its numbers, three days side by side. How the snow map works
Enough context to eliminate the obviously wrong options and surface the candidates worth opening, before you dig into a single forecast.
Map relief from SRTM and NRCan CDEM via Terrain Tiles. Contains information licensed under the Open Government Licence – Canada. Weather model data: Environment and Climate Change Canada. Forecast numbers are illustrative.
Save the spots you actually ride, each with its elevation band, aspect and terrain class. Snow Doctor reads every one two ways: what counts against it today, from the avalanche bulletin, the weather and your own answers about the slope, and how good the skiing might be, by values you set. The two are never added together, so a sunny powder day can't hide what's stacked against a slope.
The avalanche bulletin, the latest field reports, the weather at three heights and our simulated snowpack, read together and written up as one report for the region. Seven sections, each with a job.
It's rewritten as soon as something it reads changes: a new bulletin, a new weather run, or new field reports worth knowing about. The evening's report is written from the 4 PM bulletin, not the morning's.
The day's picture in two or three sentences.
What the past week did at each height, then the next two days.
The layers that matter, named by date, with what the bulletin, the field reports and the simulation each say.
The bulletin's ratings and problems, and what people saw slide this week.
The field reports: snow quality, signs of instability, and how recent they are.
Where the best snow likely is today, and why.
What to watch for and test, and three questions for the skin track.
Facts, never a verdict: it doesn't tell you whether to go. One per region, timestamped so you know how current it is.
Doctor's Orders converts to audio so you can review conditions with your crew on the way to the trailhead, without anyone staring at their phone in the dark at 5am.
After Doctor's Orders, ask a follow-up. The chat reads what the report was written from (the bulletin, field reports, simulated snowpack, and the weather hour by hour for today and tomorrow) plus your saved zones, so answers are grounded in today's picture, not generic advice. From a cabin or one of your zones, it reads that spot's own forecast too.
Built with guardrails. It won't call a slope safe, tell you whether to go, or pick a zone for you. Ask anyway and you get the facts that bear on it, and what to check on the ground. It tells you when its data is regional, and when an answer is a guess.
There's no overnight freeze this week. The freezing level sits near 4000 m, so no crust forms to soften into corn, and the surface is wet from the start.
The weather model has strong sun on south aspects from about 10 AM, warmest from noon to 3 PM. Boots sinking past the ankle on the climb is the classic sign the surface has lost its strength.
Start a plan for a day or a long weekend and send your group the link. Everyone proposes zones from their own saved spots and ranks the options privately, so the plan sorts by what the whole party wants, not by who's loudest in the chat.
Propose from a map. See every option on one map, with region outlines and recent field obs, so you can tell when two choices are three hours apart.
Ranking. Everyone sees each option's average rank and how many people voted. Nobody sees who ranked what.
Checklist and notes. Tell the group what you're bringing and what you're seeing.
Professional daily bulletins, danger ratings by elevation band, avalanche problems with aspect/elevation/likelihood detail
HRDPS, RDPS, GDPS (Environment Canada), GFS (NOAA), ECMWF: grid-point forecasts at the zone's lat/long
SLF's SNOWPACK model, run each day on HRDPS weather: layers dated the way forecasters name them, on every aspect, for every resort, cabin, saved zone and region
MIN field observations within 50km: snowpack reports, avalanche observations, access notes, weather reports, photo submissions
Your saved terrain (aspect, elevation, ATES rating, steepness) scores your zones against the forecast, and Ask the Doctor answers about them by name
The bulletin itself comes first: a three-day danger matrix with arrows for anything that changed since the previous bulletin, then each problem by likelihood, size, elevation and aspect, flagged when it is new or growing.
Switch to At a glance and the bulletin is read alongside everything else. Each layer of concern shows what the bulletin, the field reports and our simulated snowpack each say about it, tagged by source, then where they agree or differ, a confidence score and a day-out checklist. Facts only: it never tells you whether to go. The full write-up is in Doctor's Orders, from the AI button in the corner.
One table runs from last week into next: temperature, freezing level, precip type, wind and sun, by morning, afternoon and night.
Seven charts built for touring: freeze-thaw, freezing level against your elevation, wet-slide windows, wind, snow load, fog risk and pressure. The Score view sums it all up.
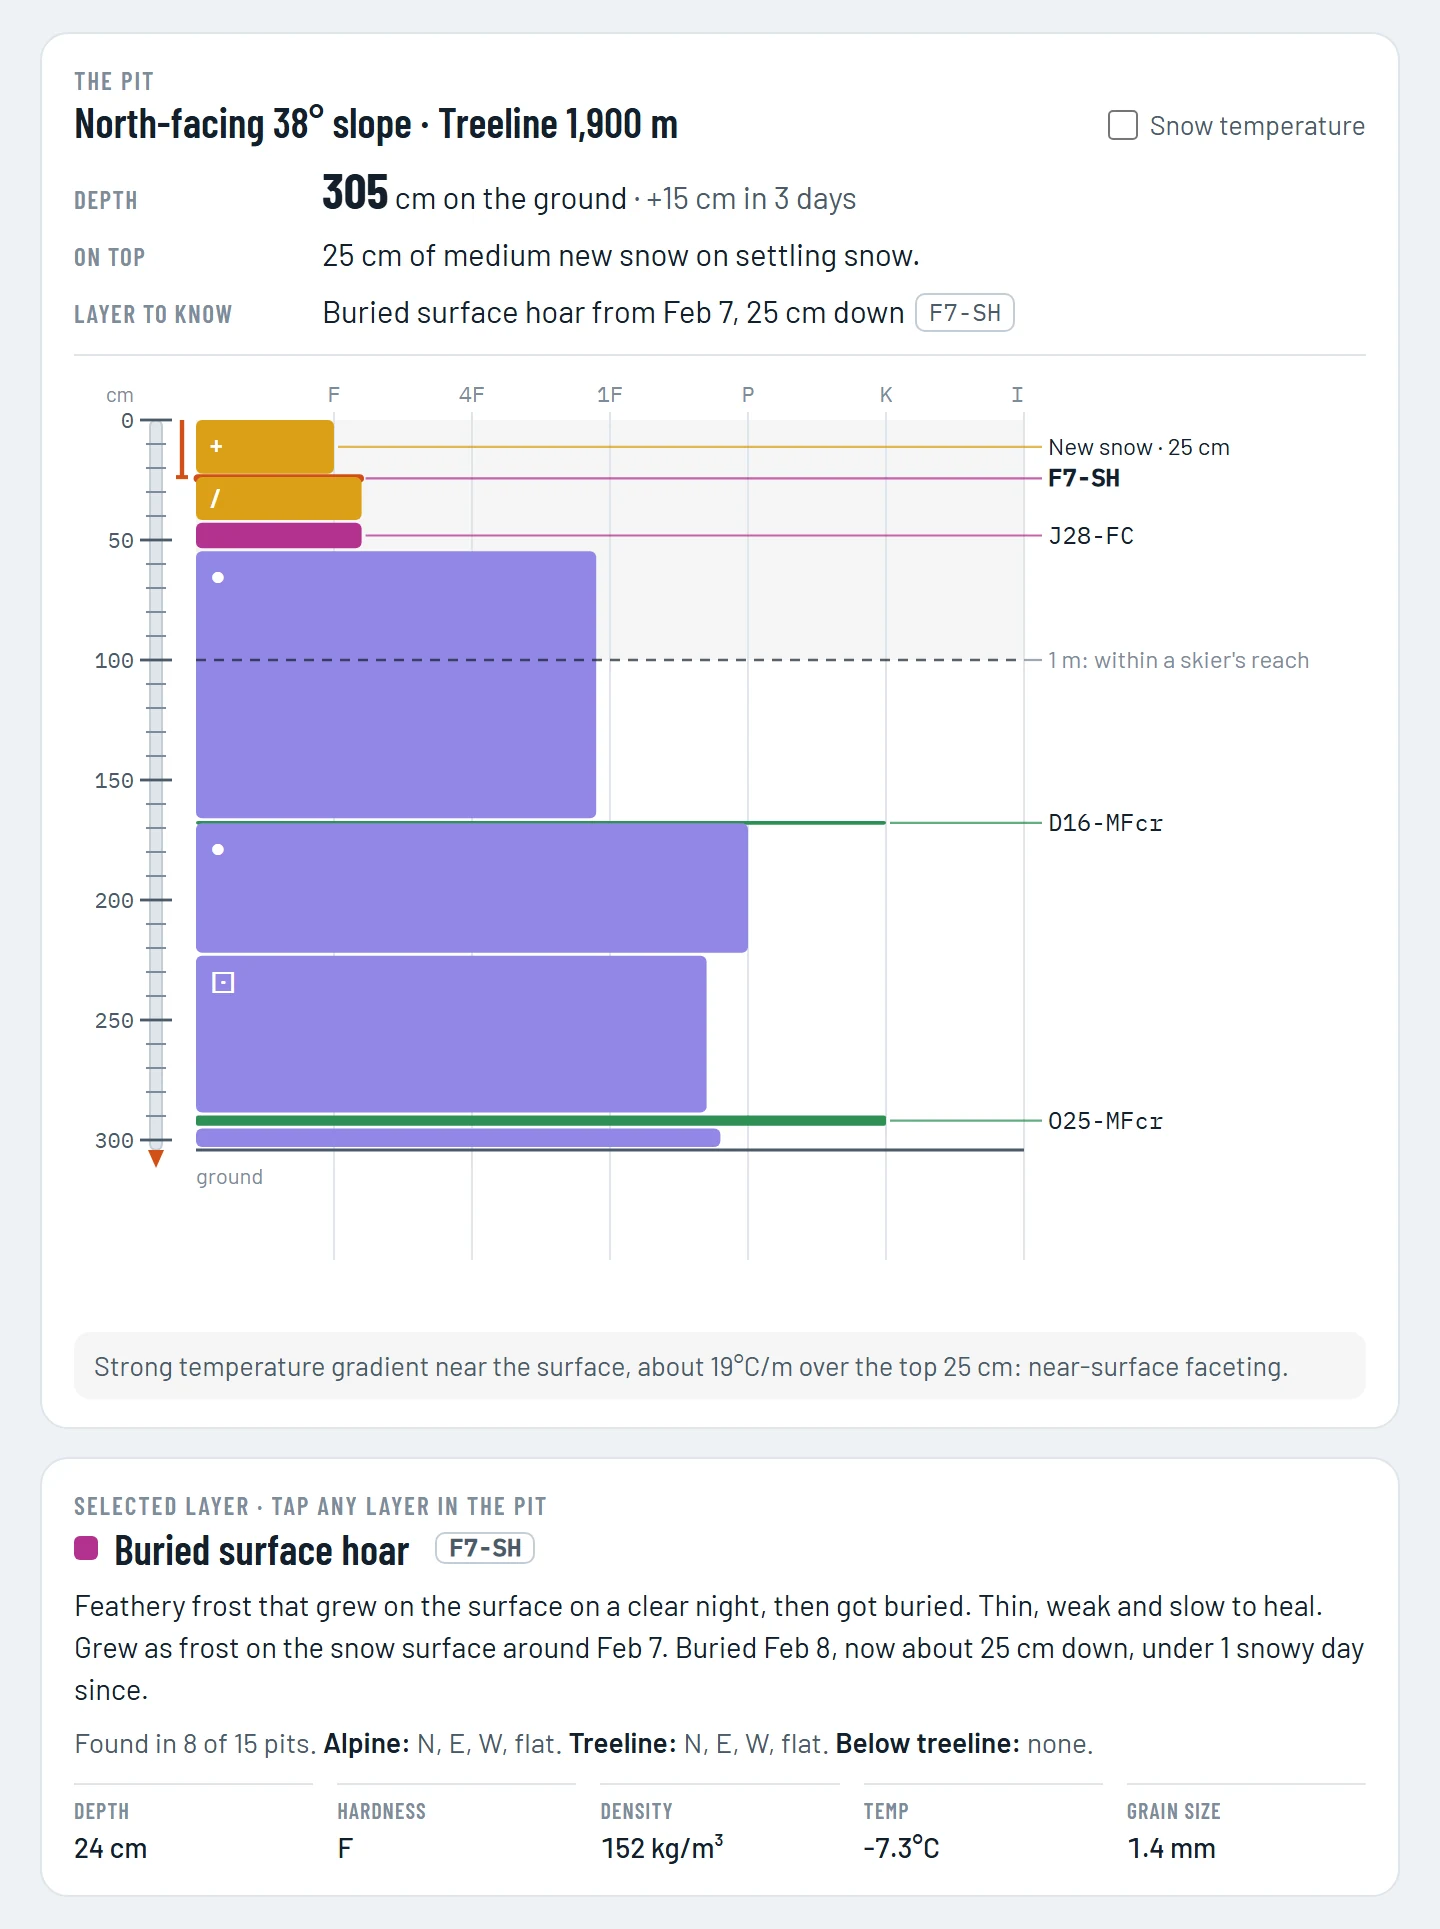
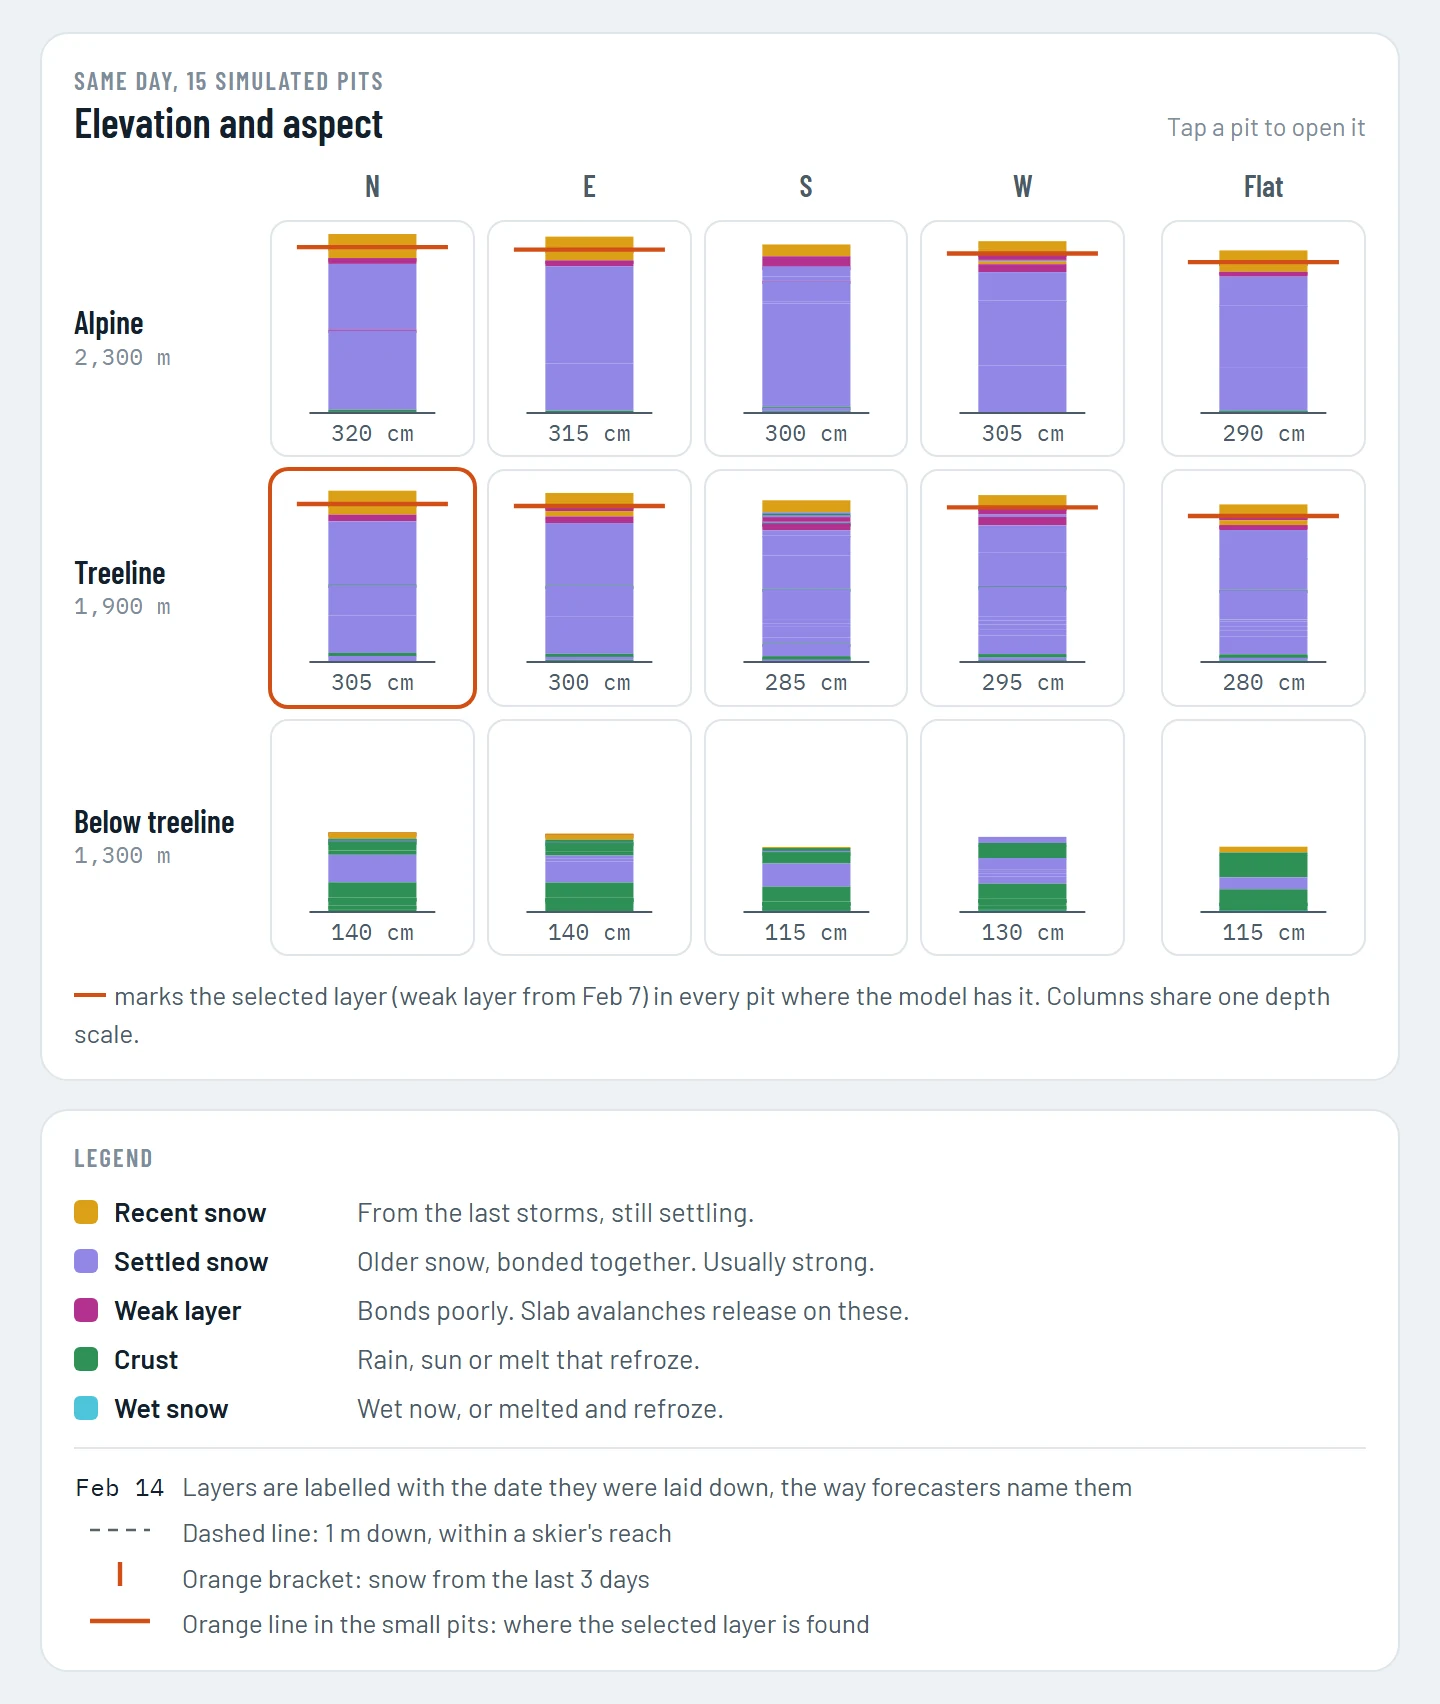
The Snowpack tab runs SNOWPACK, the snow-cover model from Switzerland's SLF, on Environment Canada's HRDPS weather from October 1 to this morning. Every resort, cabin, saved zone and forecast region gets a simulated pit: each layer drawn by hardness, the way you'd draw a real one, and dated the way the bulletin names it, so "the Feb 7 surface hoar" means the same thing on both screens.
Tap a layer for its story: when it formed, when it was buried and how deep it sits now. Line up the same day across elevations and aspects to see where a weak layer survived and where the sun crusted it over. A saved zone is simulated at its own elevation and slope angle, on all eight aspects.
Simulated, not observed. It's built from weather data, so it can't see wind loading on a slope or snow the forecast missed. Use it to know what to look for, then check. How we simulate the snowpack
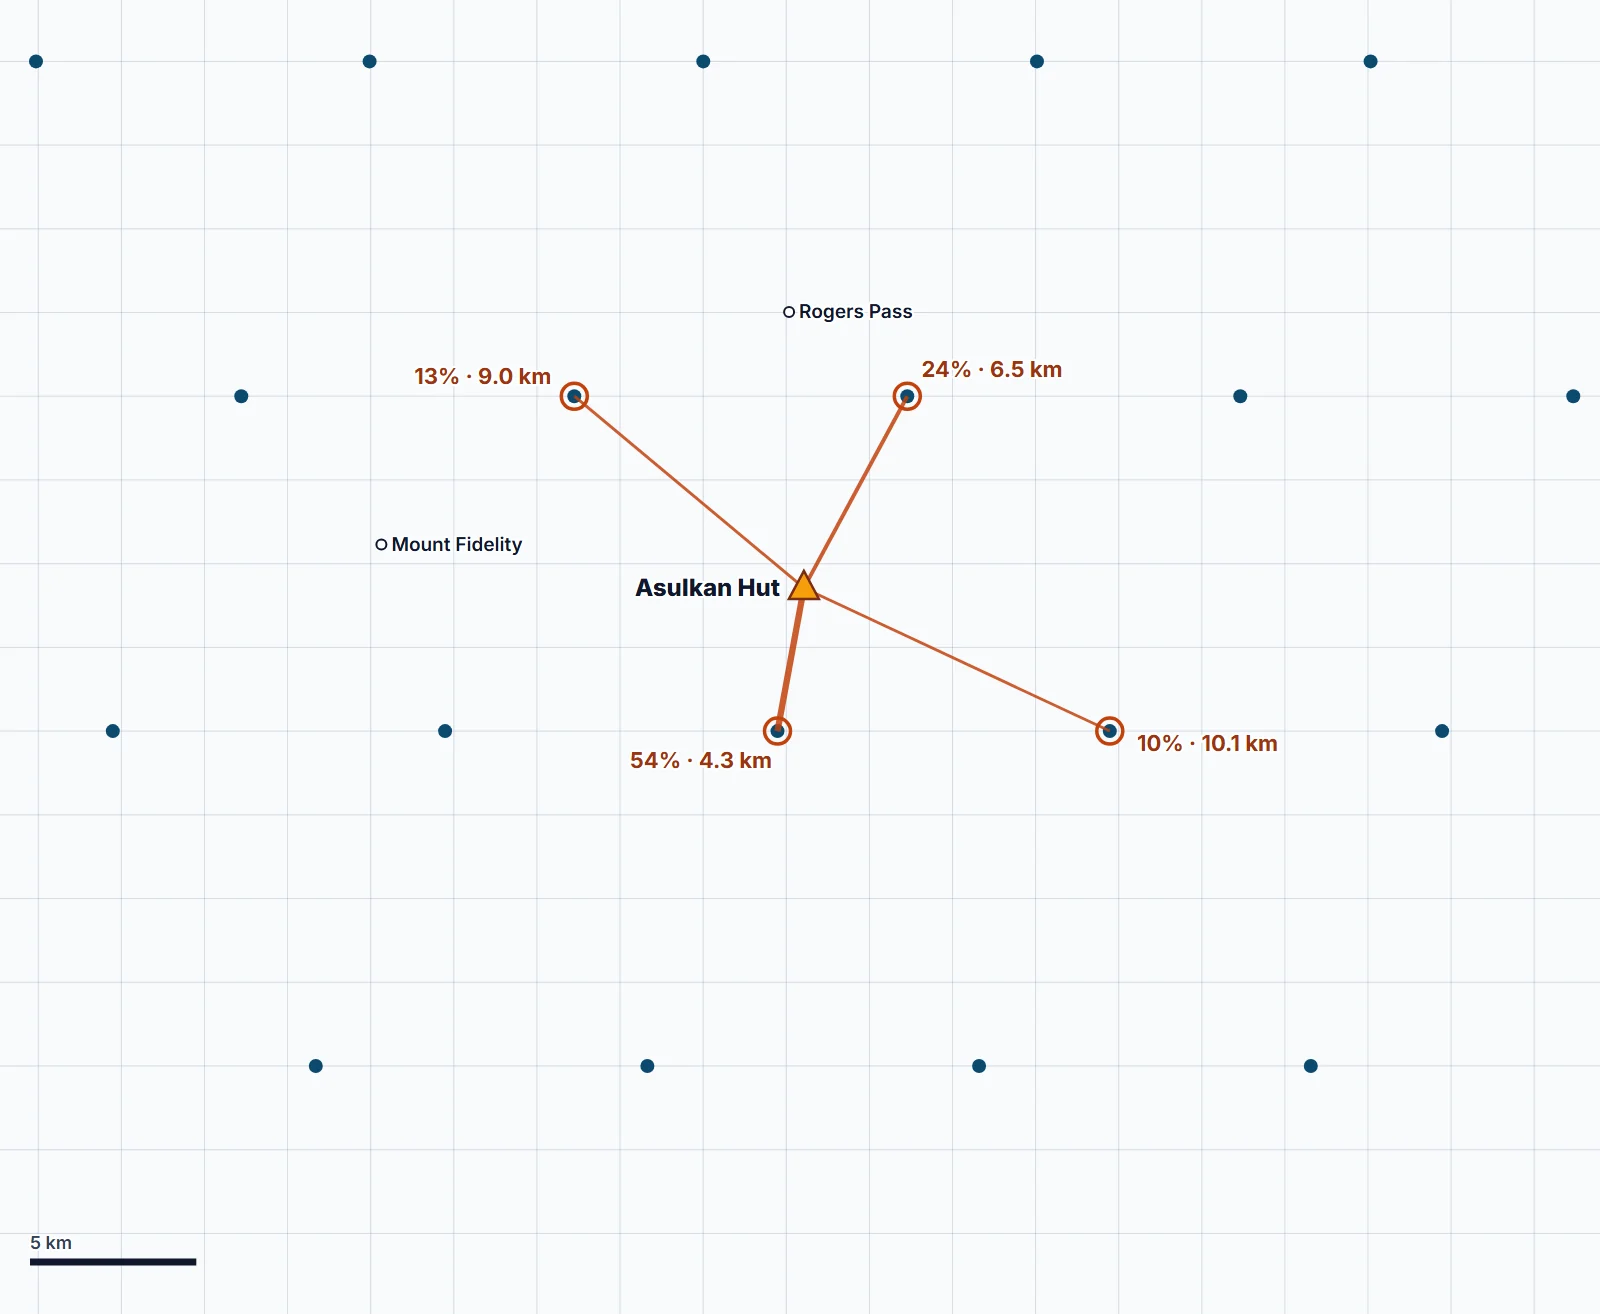
The Obs tab pulls MIN reports within 50km and synthesizes them into a single field report. Instead of clicking through five individual observations (each with different detail levels, distances, and relevance) you get one clear read: how fresh and representative the data is, what riders are actually finding on the ground, and what terrain they're avoiding. Every report lands on a map first, marked red where someone saw an avalanche or an incident, with the full list and the Field Score one tap away.
A good MIN report is gold. But most people don't have time to read dozens of them and weigh proximity, recency, and credibility on the fly. Snow Doctor lightens the load, and you pick which ones to read in full.
Map relief from SRTM and NRCan CDEM via Terrain Tiles. Contains information licensed under the Open Government Licence – Canada. Lakes, glaciers and roads © OpenStreetMap contributors. Reports are illustrative.
Verified August 2026. Full breakdown in the backcountry tools guide.
| Feature | Snow Doctor | OpenSnow | SpotWx | Snow‑Forecast | Windy | Mtn‑Forecast |
|---|---|---|---|---|---|---|
| Avy danger ratings | ✓ | ✓ | ✕ | ✕ | ✕ | ✕ |
| Avy problems detail | ✓ | Links out | ✕ | ✕ | ✕ | ✕ |
| Field obs (MIN) | ✓ | ✕ | ✕ | ✕ | ✕ | ✕ |
| Weather models | ✓ 5 | ✓ PEAKS | ✓ 20+ | Basic | ✓ | ✓ |
| BC-tuned charts | ✓ 7 | ✕ | ✕ | ✕ | ✕ | ✕ |
| AI synthesis | ✓ | Resorts | ✕ | ✕ | ✕ | ✕ |
| Simulated snowpack | ✓ | ✕ | ✕ | ✕ | ✕ | ✕ |
| Audio / Car Mode | ✓ | ✕ | ✕ | ✕ | ✕ | ✕ |
| 7-day history | ✓ | ✓ | ✕ | ✕ | ✕ | ✕ |
| 7-day forecast | ✓ | ✓ | ✓ | Paid | ✓ | ✓ |
| Zone saving + scoring | ✓ | Saving only | ✕ | ✕ | ✕ | ✕ |
| Group trip plans beta | ✓ | ✕ | ✕ | ✕ | ✕ | ✕ |
| Shared gear checklist beta | ✓ | ✕ | ✕ | ✕ | ✕ | ✕ |
| Regional overview | ✓ | Resorts | ✕ | ✕ | ✕ | ✕ |
| BC / Rockies focus | ✓ | Global | Global | Resorts | Global | Global |
Swipe to compare →
Open any of the 50+ BC and Rockies zones and get the full briefing: the bulletin, the weather, the field reports and a simulated snowpack, read together in one report.
Open Snow DoctorAlso in blog: How Snow Doctor compares to every other tool