
Regions and heights
A region's numbers come from five points in it, at three heights set from its ski terrain.
Updated November 13, 2026
Regions
- Count
- 100+ forecast regions
- Area
- BC and the Canadian Rockies
- Outlines
- The avalanche forecast regions, as published
Every spot belongs to a region and takes its bulletin from it. Resorts, cabins and mountains sit in one too.
Five weather points
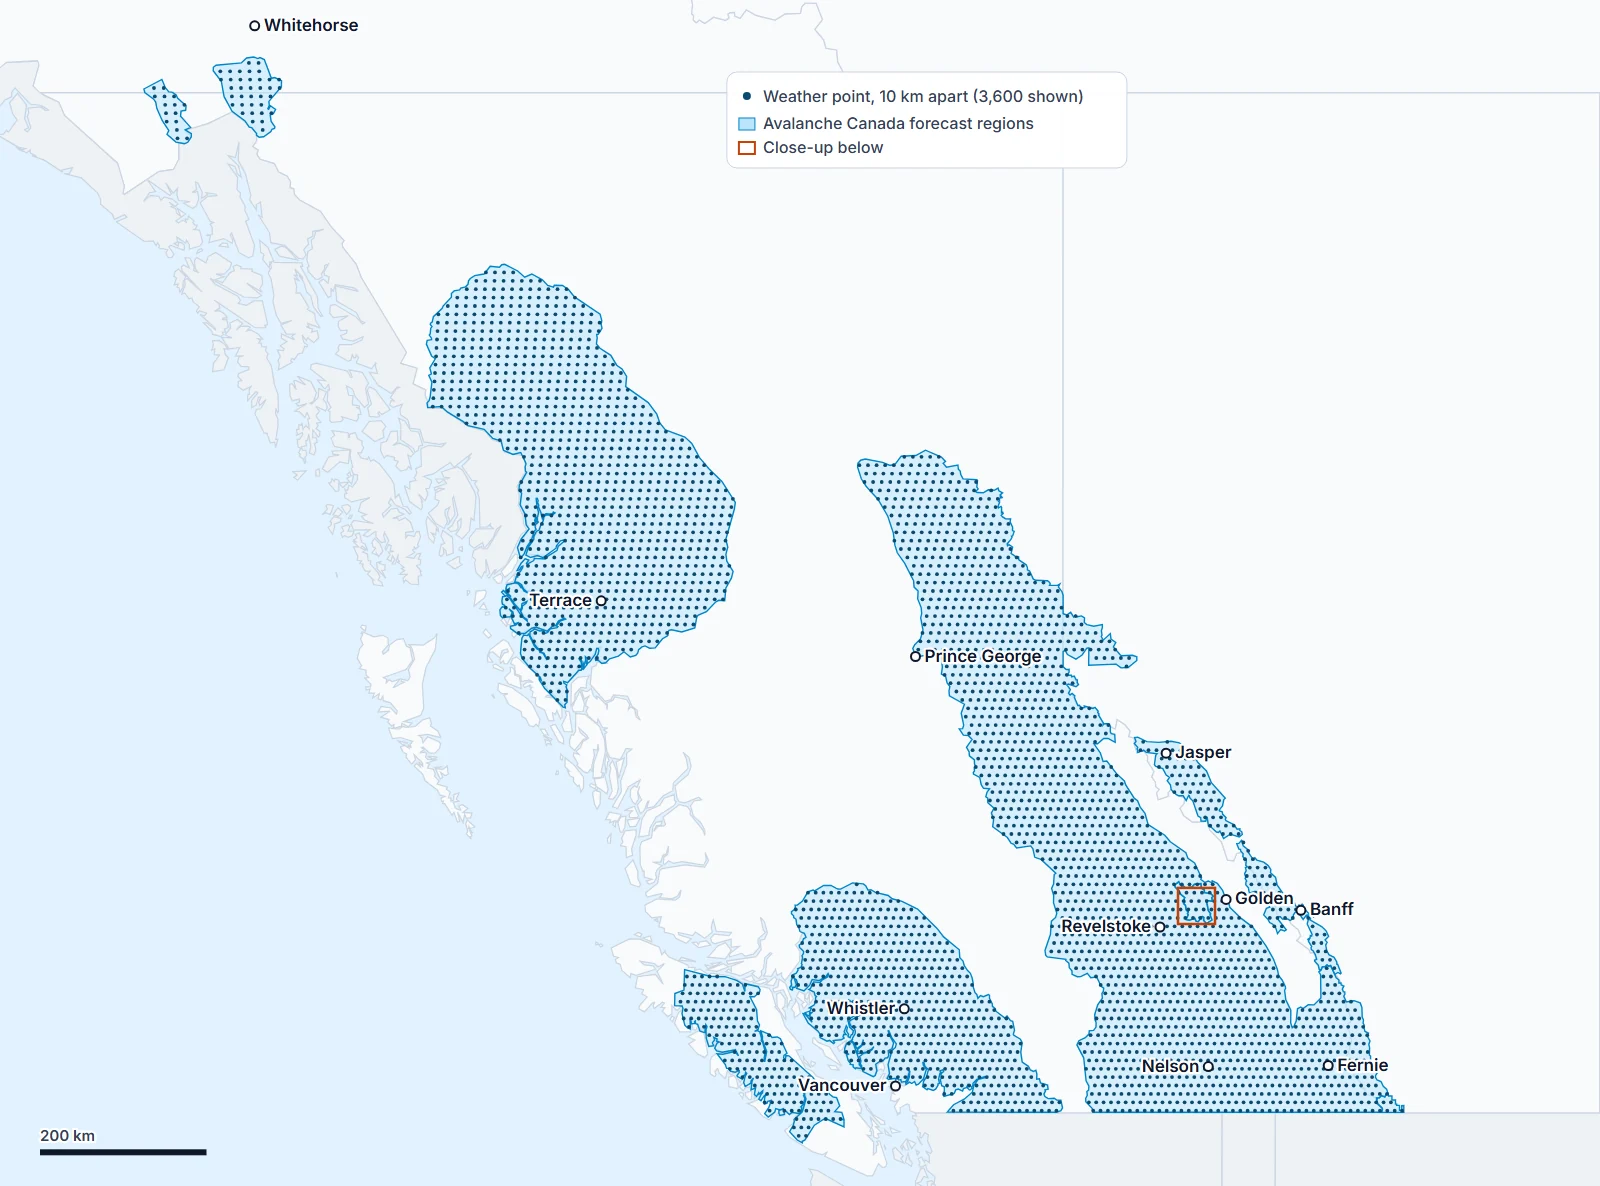
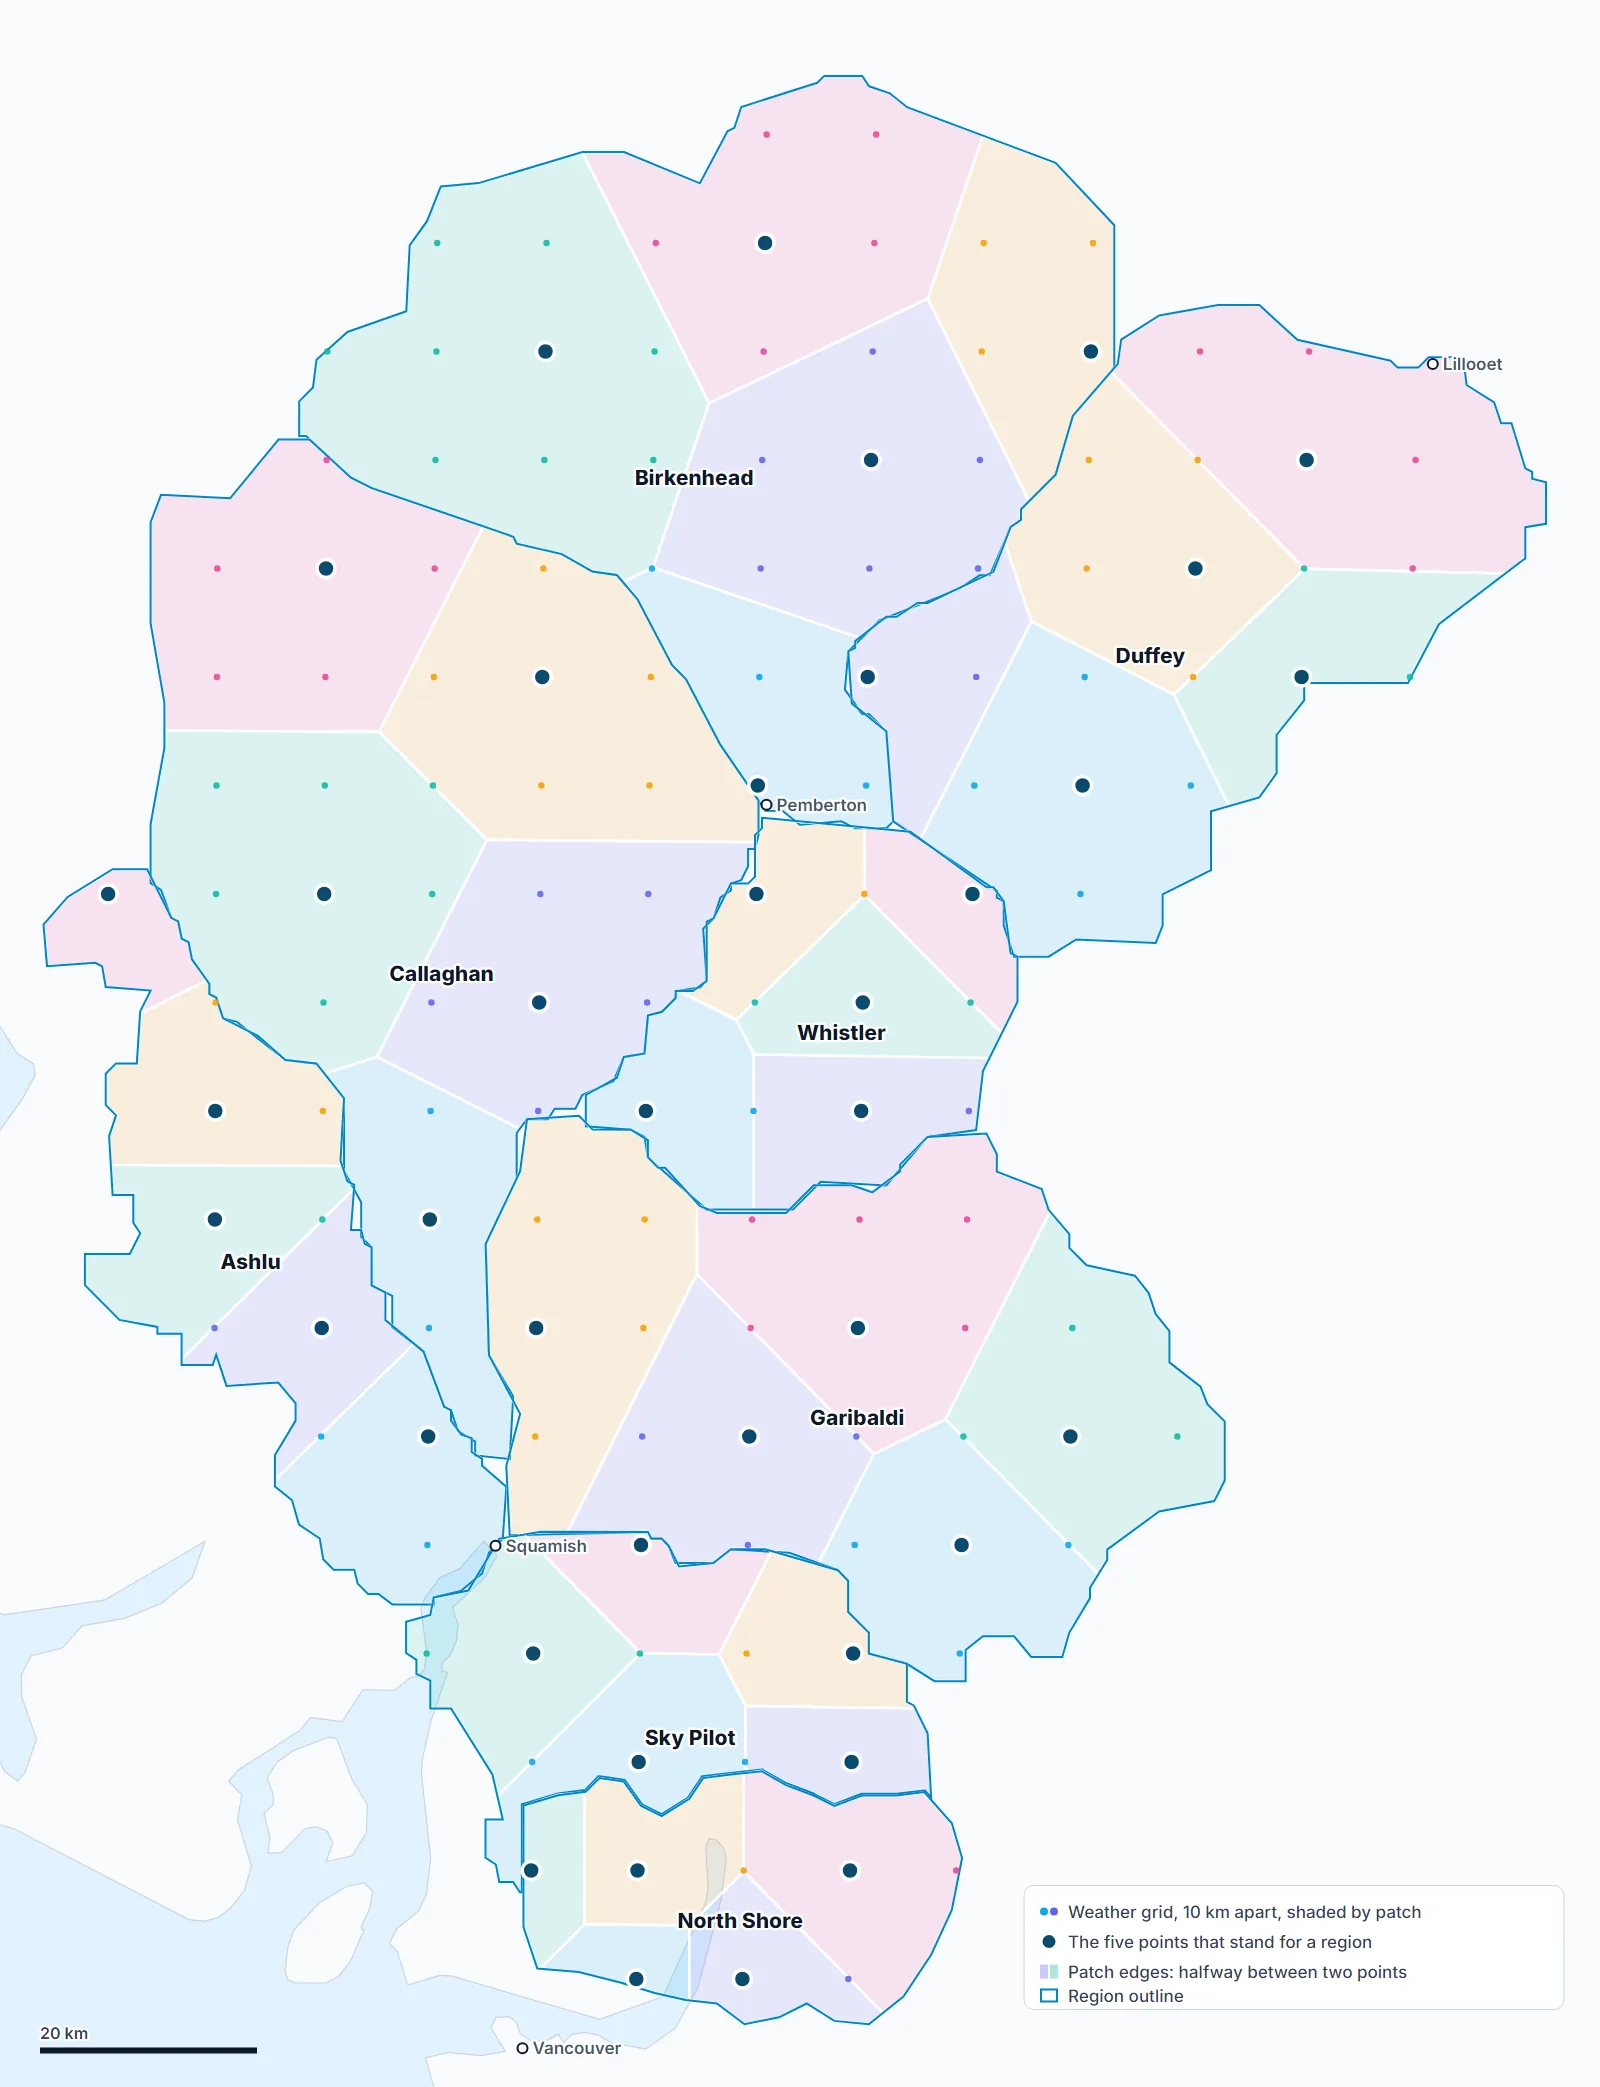
- Grid. About 3,800 points, 10 km apart, over every region. Where regions overlap, the smaller one gets the points. Every region gets at least three.
- Neighbourhoods. A region's points are split into five by k-means clustering, seeded the same way every run.
- One point per neighbourhood. The one whose ground is closest to the region's middle height (to the nearest 50 m), then the one nearest the neighbourhood's centre.
- Weights. Each point counts for its neighbourhood's share of the region. A neighbourhood under 5% of the region is dropped.
- Each point's weather is fetched at the region's three heights and averaged hour by hour.
- Wind direction is averaged as a vector weighted by speed: 350° and 10° make 0°.
- A point with no number sits out and the others share its weight. 0 cm counts as a number. A region shows a dash only when no point has one.
- The simulated snowpack runs on the same five points.
Used by previews, Compare, the Weather tab and the report. The map draws its own 3 km squares instead (see The map).
A region's three heights
Lower, middle and upper, measured from the ground inside the outline:
- Keep slopes of 20° to 45°, steep enough to ski.
- Drop steep ground more than 900 m under the local tree line (forested valley walls).
- Lower is the height 10% of what's left sits under, middle the halfway height, upper the height 95% sits under. Rounded to 100 m.
- Heights read from NRCan's elevation map in 60 m squares; the tree line from the elevation band layer.
- Where people ski one small part of a region, only the ground within a few km of it is measured: Kootenay Pass, Whitewater-Ymir, Rossland, the Coquihalla summit, Sky Pilot, Tetrahedron, Mount Washington, Mount Cain, Mount Arrowsmith.
- The North Shore keeps hand-set heights: 950, 1,200 and 1,600 m.
- Checked at 34 places with known ski heights (resort tops, trailheads, huts): within about 150 m, against about 300 m for the old flat guess of 1,000, 1,500 and 2,000 m.
These are not the bulletin's bands. Alpine, treeline and below treeline describe terrain; these heights span the skiable ground, so a region's upper height can sit below the alpine. The app opens on the upper height.
Spots, resorts, cabins and mountains
| Place | Heights | Forecast |
|---|---|---|
| Spot (pin) | Its own height | Its own point, at that height |
| Spot (line) | Its top | Its own point, at the line's highest point |
| Resort | Top, middle, base, from the resort's own heights | Its own point |
| Cabin | The hut | Its own point |
| Mountain | Summit; 800 m below it (or the lowest ground within 3 km, at least 300 m below); halfway | Its own point |
Summit heights read about 50 m low on average, and 200 to 400 m low on steep, pointed peaks, because the elevation map's 90 m squares smooth the top. Points that read 500 m or more under the published height are fixed by hand.
Weather at a height
- Temperature is the air's at that height, read between the model's nine levels. Open-Meteo's own height adjustment (6.5°C per km from the ground) isn't used: on October 14, 2026 at Ashlu it read −1.7°C at 2,000 m when the air was +3.4°C, and rain counted as snow.
- Rain or snow comes from that temperature and the air's humidity (below).
- Freezing level is the same at every height of a place. Only the highest height asks for the nine levels; the others borrow them.
- Wind: lower is the wind 10 m above the ground, middle 80 m above the ground, upper the free air at about 3,000 m (700 hPa), what a ridge feels.
Rain or snow
- Reads
- The air's temperature at the height and the model's humidity near its ground
- Method
- Jennings and others (2018), refit to BC and Alberta
- Fit to
- 25 BC and Alberta airports, October 2025 to April 2026: 24,000+ hours reported as rain or snow
Snow can fall through air above 0°C. In dry air some of it evaporates on the way down, which cools it, so it lasts to warmer temperatures. After temperature, humidity decides the most.
| Humidity | All snow below | Half snow at | All rain from |
|---|---|---|---|
| 100% | −0.9°C | +0.3°C | +1.6°C |
| 90% | −0.4°C | +0.9°C | +2.1°C |
| 80% | +0.2°C | +1.4°C | +2.6°C |
- The equation:
snow = 1 / (1 + exp(a + bT + cH)), T the temperature in °C, H the humidity in %. The paper's numbers are a −10.04, b 1.41, c 0.09; ours are a −9.91, b 1.79, c 0.093. - Why refit: the paper's numbers come from 17.8 million reports across the Northern Hemisphere. Here they called 22% too much snow. The paper's own map puts the Pacific Northwest among the coldest switches.
- Humidity is the model's, from its temperature and dew point near the ground. Humidity at the height itself tested no better.
- Weather saved before November 13, 2026 has no humidity and reads 96%, the middle of the model's humidity in hours of rain or snow near 0°C.
- Used by the weather table, charts, Compare, previews, the report and the simulated snowpack. The map's Snowfall layer is the model's own snow.
Tested on airports left out of each fit, in the hours between −1 and +4°C (about 6,900):
| Rule | Hours right | Snow, against reports |
|---|---|---|
| 0 to 2°C mix (before November 13, 2026) | 84% | 16% too much |
| The paper's numbers | 89% | 22% too much |
| Ours | 90% | Within 1% |
With the model's forecast in place of the airports' own readings, August to November 2026: 94% of hours right, against 90% for the old rule.
Reference: Jennings, K. S., Winchell, T. S., Livneh, B. and Molotch, N. P. (2018). Spatial variation of the rain–snow temperature threshold across the Northern Hemisphere. Nature Communications 9, 1148.
Days
- A day is midnight to midnight, Pacific time, everywhere: the map, Compare, previews and Ask. Nothing counts "the next 72 hours from now".
- Chart hours are the place's own clock. Rockies regions are on Mountain time, an hour ahead.
Design decisions
| Choice | Reason | Cost |
|---|---|---|
| Five points per region | One point can't speak for a region with inlets and icefields | A storm on one corner averages down; ten points under study |
| Points near the middle height | Points picked by position alone landed in valley bottoms around Whistler, which read drier | |
| Heights from ski terrain | A flat 1,000 / 1,500 / 2,000 m put the Rockies' upper height in the trees and the coast's above its summits | Measured once; rerun when outlines change |
| Humidity in rain or snow | The 0 to 2°C mix left out dry air and called 16% too much snow | Fit to one winter |
| Pacific days | Two ways of counting gave two answers on the same screen | An hour of Rockies weather lands on the next day |
Limitations
- A region's number is an average. Its colours on the map show the spread.
- A region's lower height can sit above a resort's base.
- On a clear, calm night the snow surface gets colder than the air the temperatures come from.
- Rain or snow was fit at airports under 1,100 m. Thinner mountain air keeps snow to slightly warmer temperatures (about 0.3°C per 10 kPa in the paper); the rule leaves that out.
- With the forecast, inland valley airports got 14% less snow than reported this fall. The model misses cold air pooled in valleys.
Something here wrong or unclear? Write to hello@snowdoctor.ca.