
Snowpack
A simulated snow pit for every region, spot, resort and cabin in BC and the Canadian Rockies, from SLF's SNOWPACK model.
Updated November 13, 2026
- Model
- SNOWPACK, WSL Institute for Snow and Avalanche Research SLF, run unmodified (LGPL)
- Weather
- HRDPS, 2.5 km, through Open-Meteo, hour by hour from October 1
- Step
- 5 minutes
- Where
- BC and the Canadian Rockies
- Label
- Always "simulated". Nobody dug this pit.
Model
SNOWPACK follows one column of snow, ground to surface, in about a hundred thin layers, and updates each layer every step: settling, heat flow and faceting, surface hoar on calm clear nights, melt and refreeze into crusts, and each layer's grain type and hardness. Developed at SLF since the 1990s and run for the Swiss avalanche warning service.
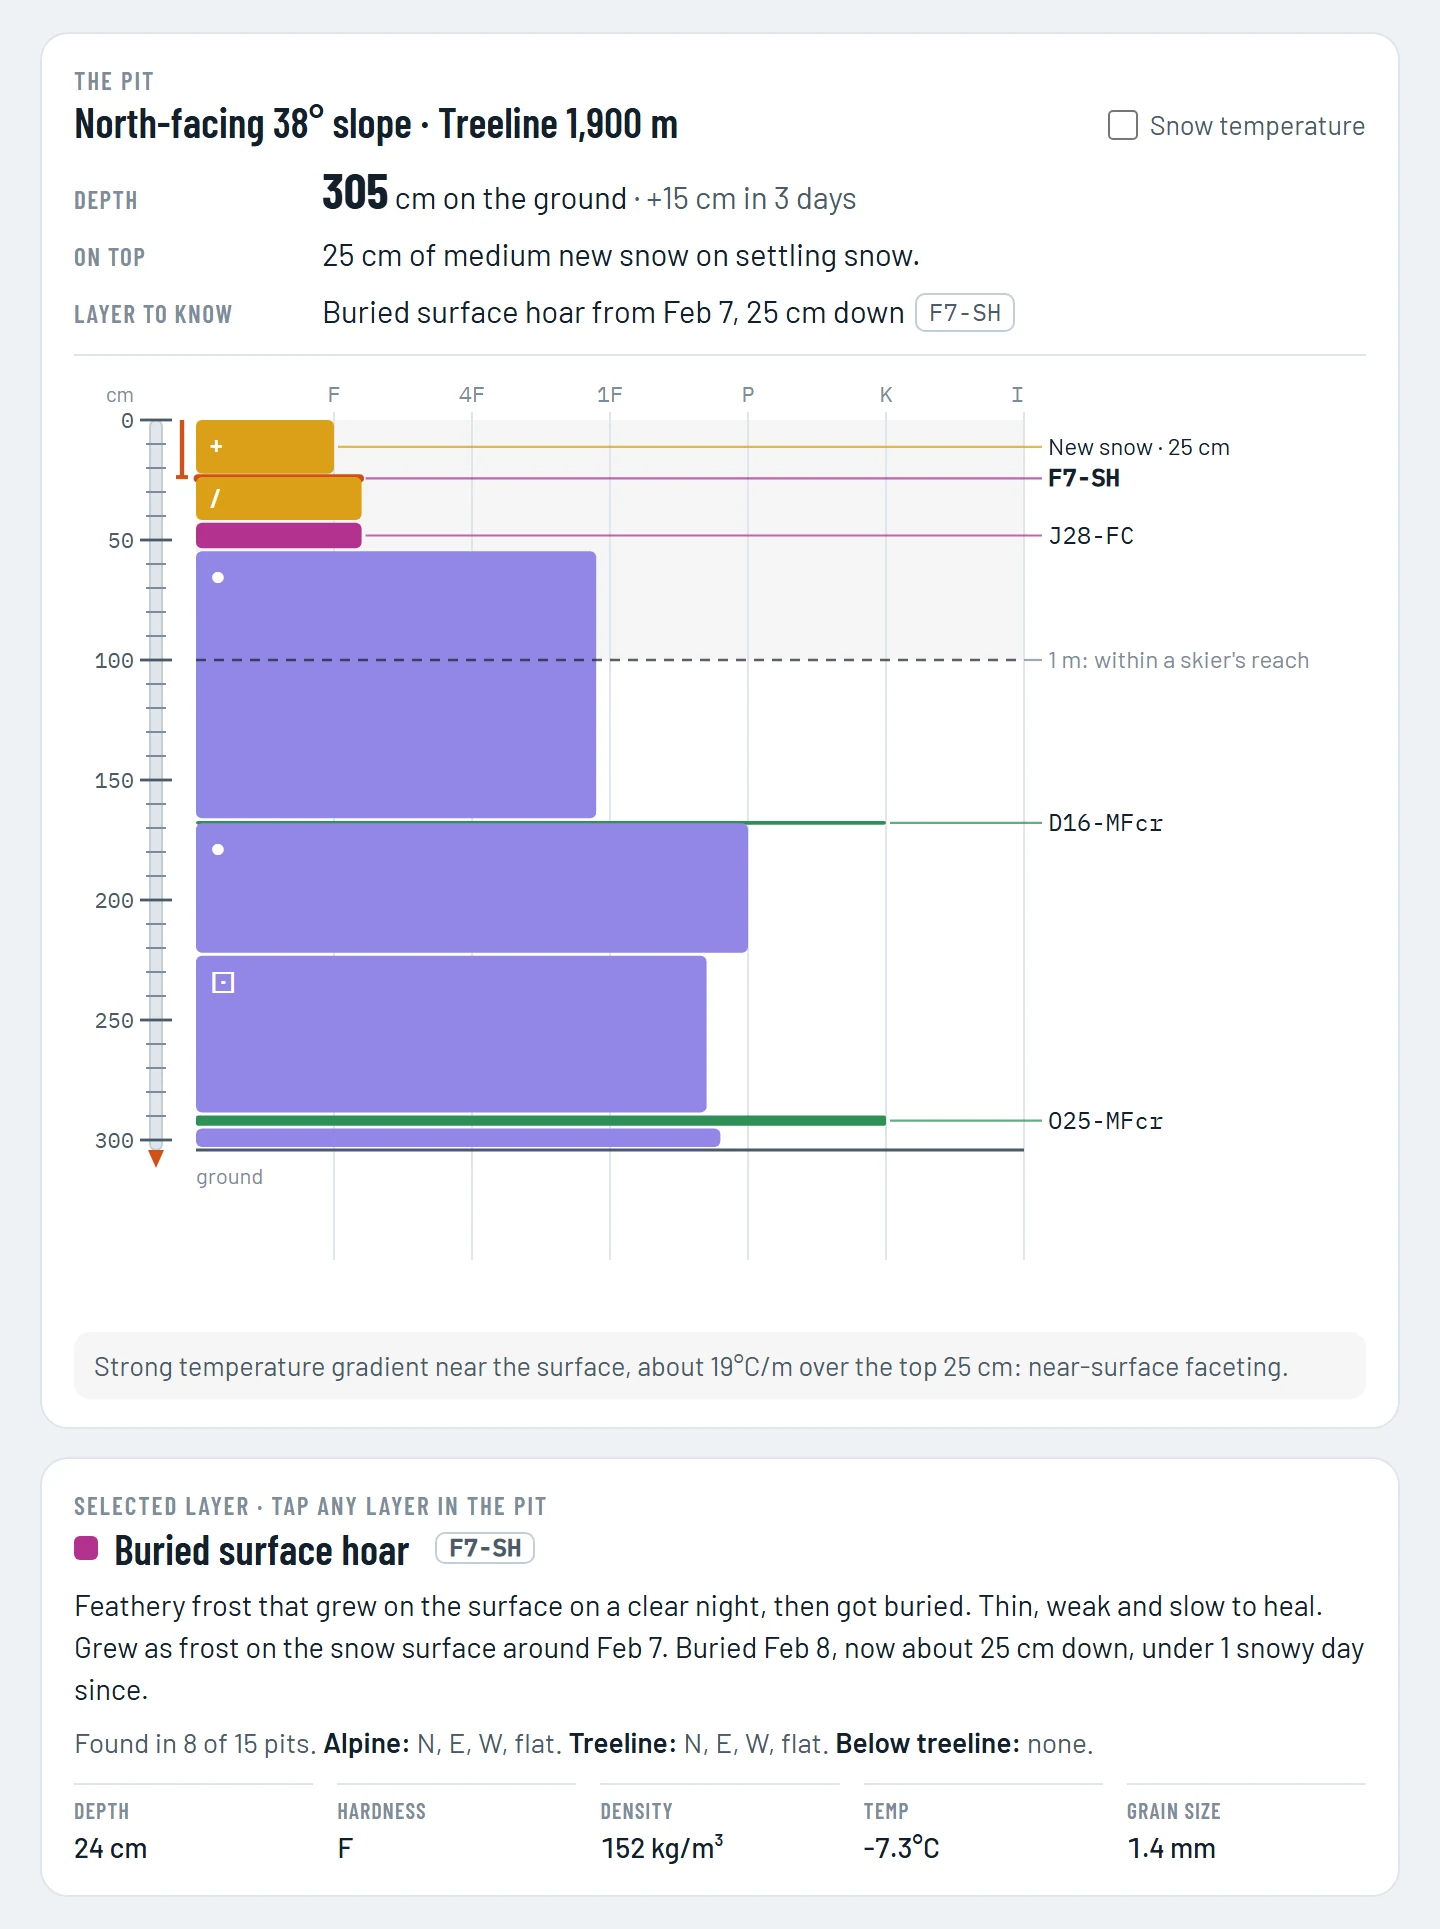
Layers are dated the way forecasters name them, with grain types from the International Classification for Seasonal Snow on the Ground: F7-SH is surface hoar from February 7.
Weather input
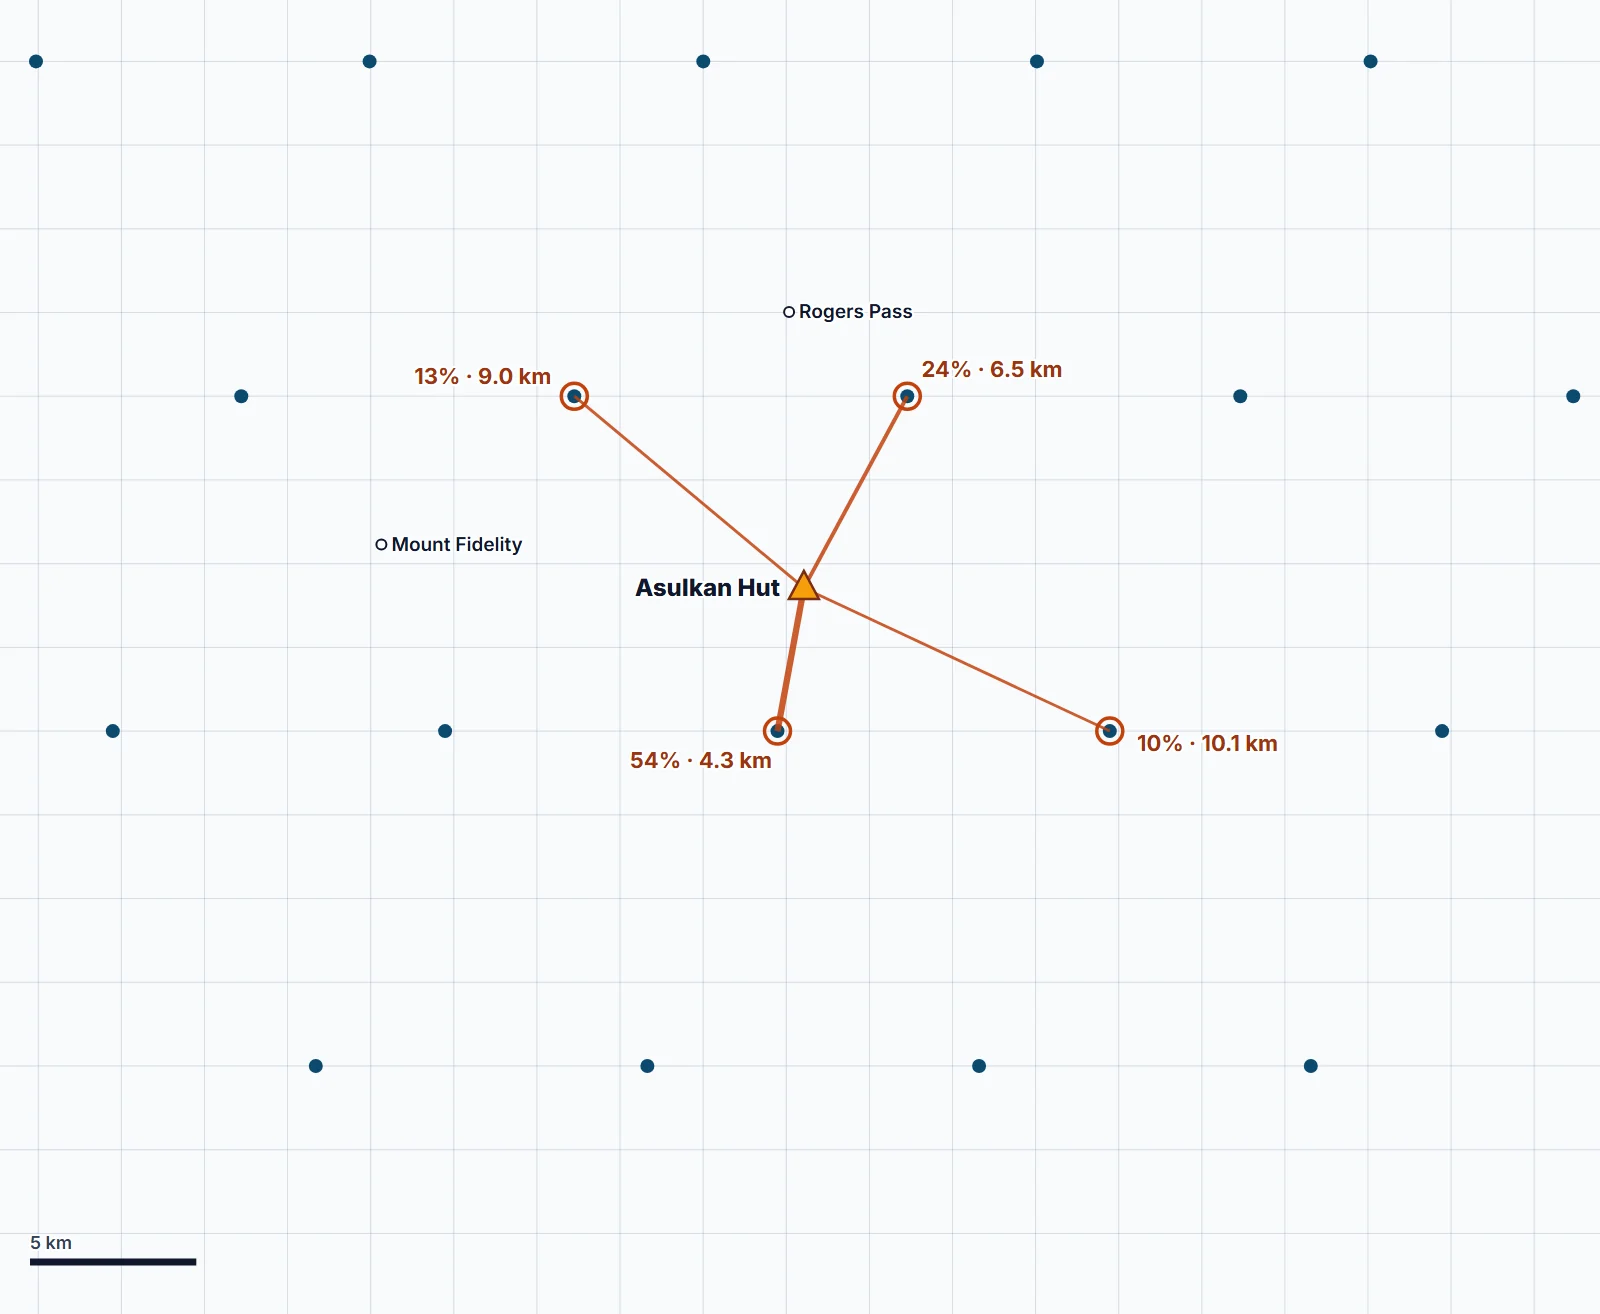
- A season's weather is kept for about 3,800 points, 10 km apart, each at its region's three heights.
- A spot blends the four points around it (the nearest always within about 7 km), closest counting most, adjusted to the spot's height.
- Rain or snow is the app's rule, from HRDPS's air at the spot's height and its humidity. Each hour is all one or the other, whichever is more likely: about +0.6°C in storm air.
- Precipitation is raised 10% to make up for the blending (measured snow ran 1.14 times the blended weather at 85 stations).
- Every season starts on October 1 from bare ground, so a spot made in January still gets its full season.
Slopes simulated
| Place | Simulated on |
|---|---|
| Resort, cabin, region | Flat ground and four 38° slopes facing N, E, S and W |
| Spot as a pin | 38°, where most slab avalanches start, on its aspect |
| Spot as a line | Its steepest part's angle |
Views
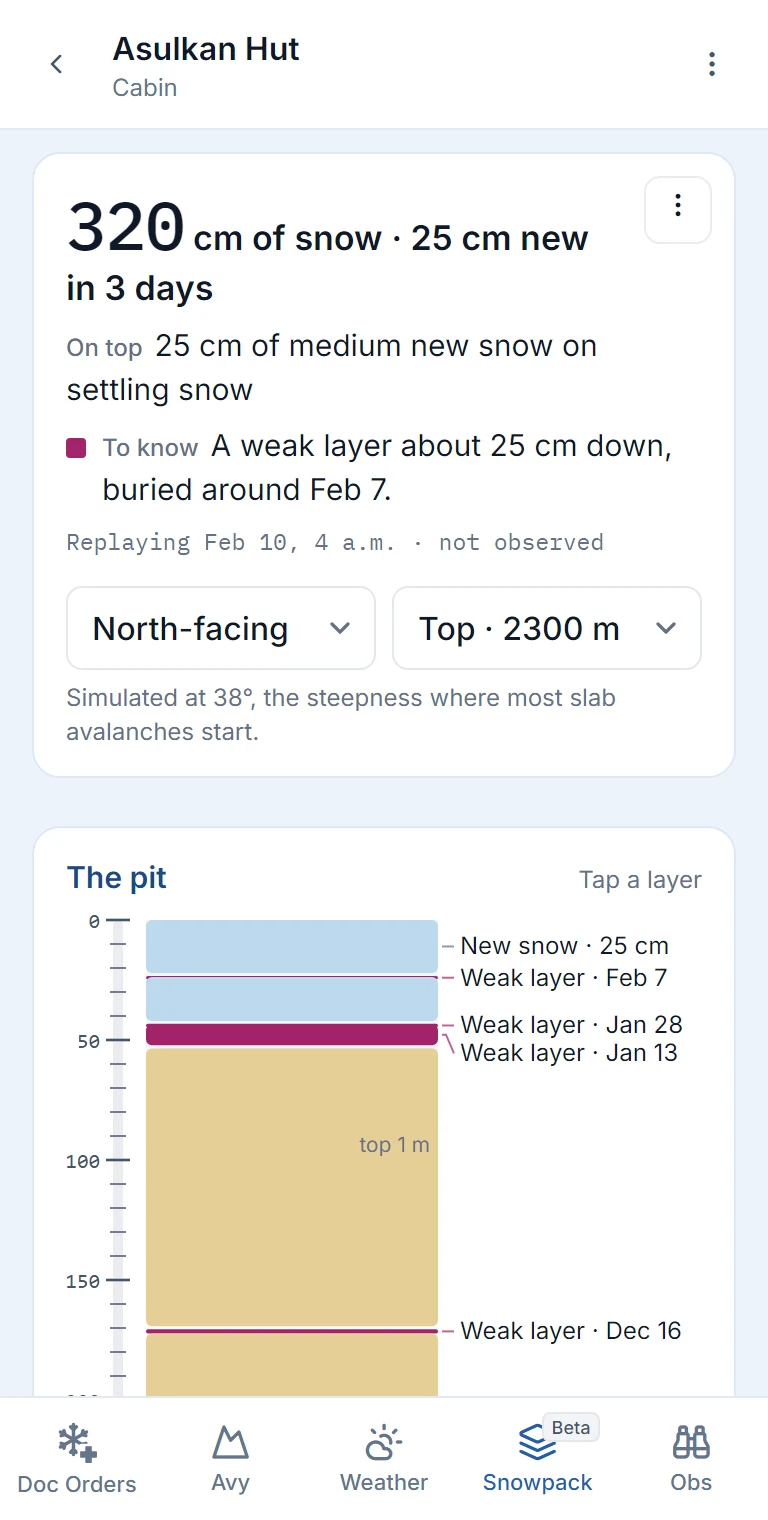
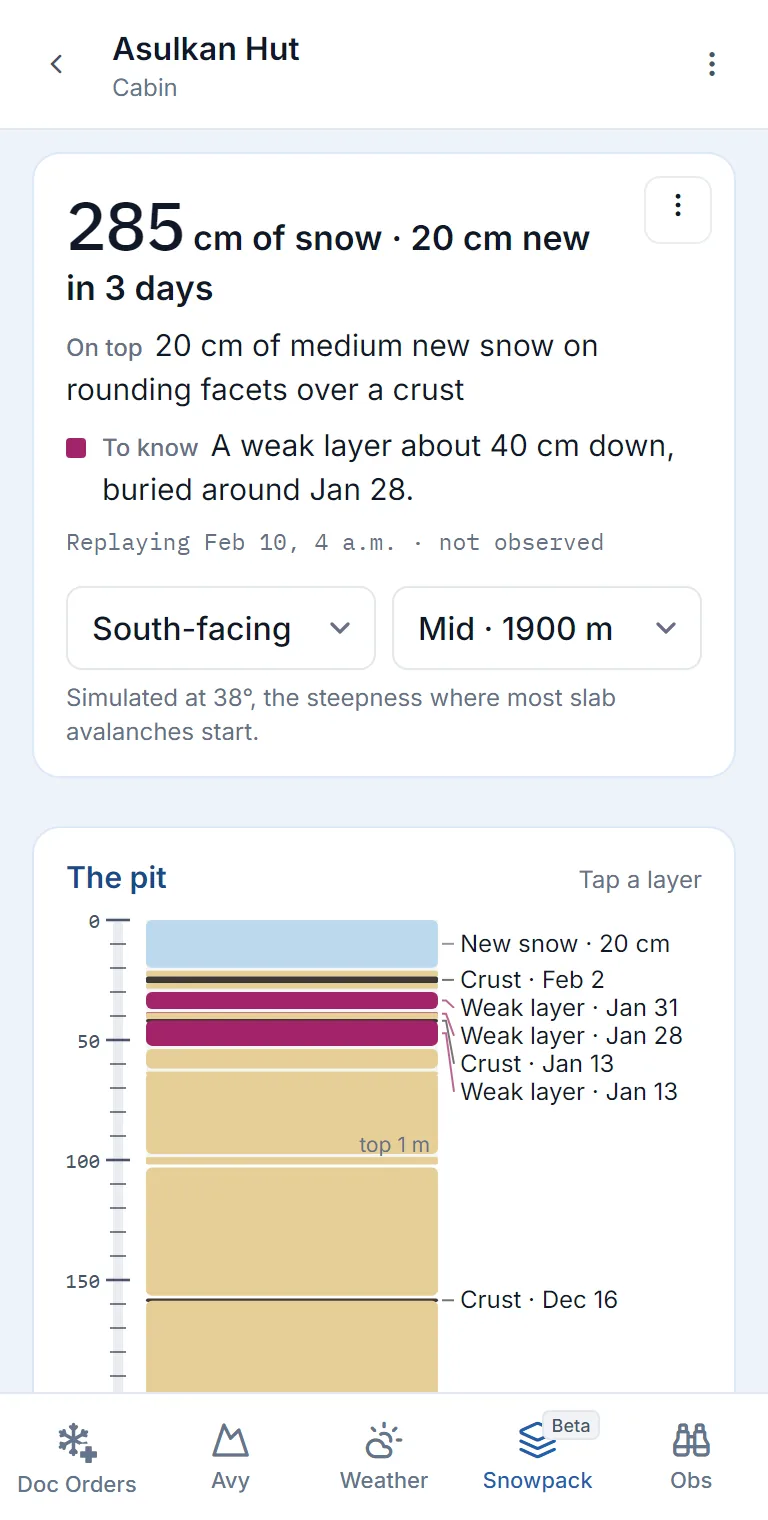
- Simple: depth, new snow, what's on top, the layer to know, then the pit with each layer labelled by date. Two menus pick the slope and the height. Depths rounded to 5 cm.
- Detailed: hand hardness (F to I), grain types and forecaster-style names (F7-SH), snow temperature, and the selected layer's depth, density, temperature and grain size.
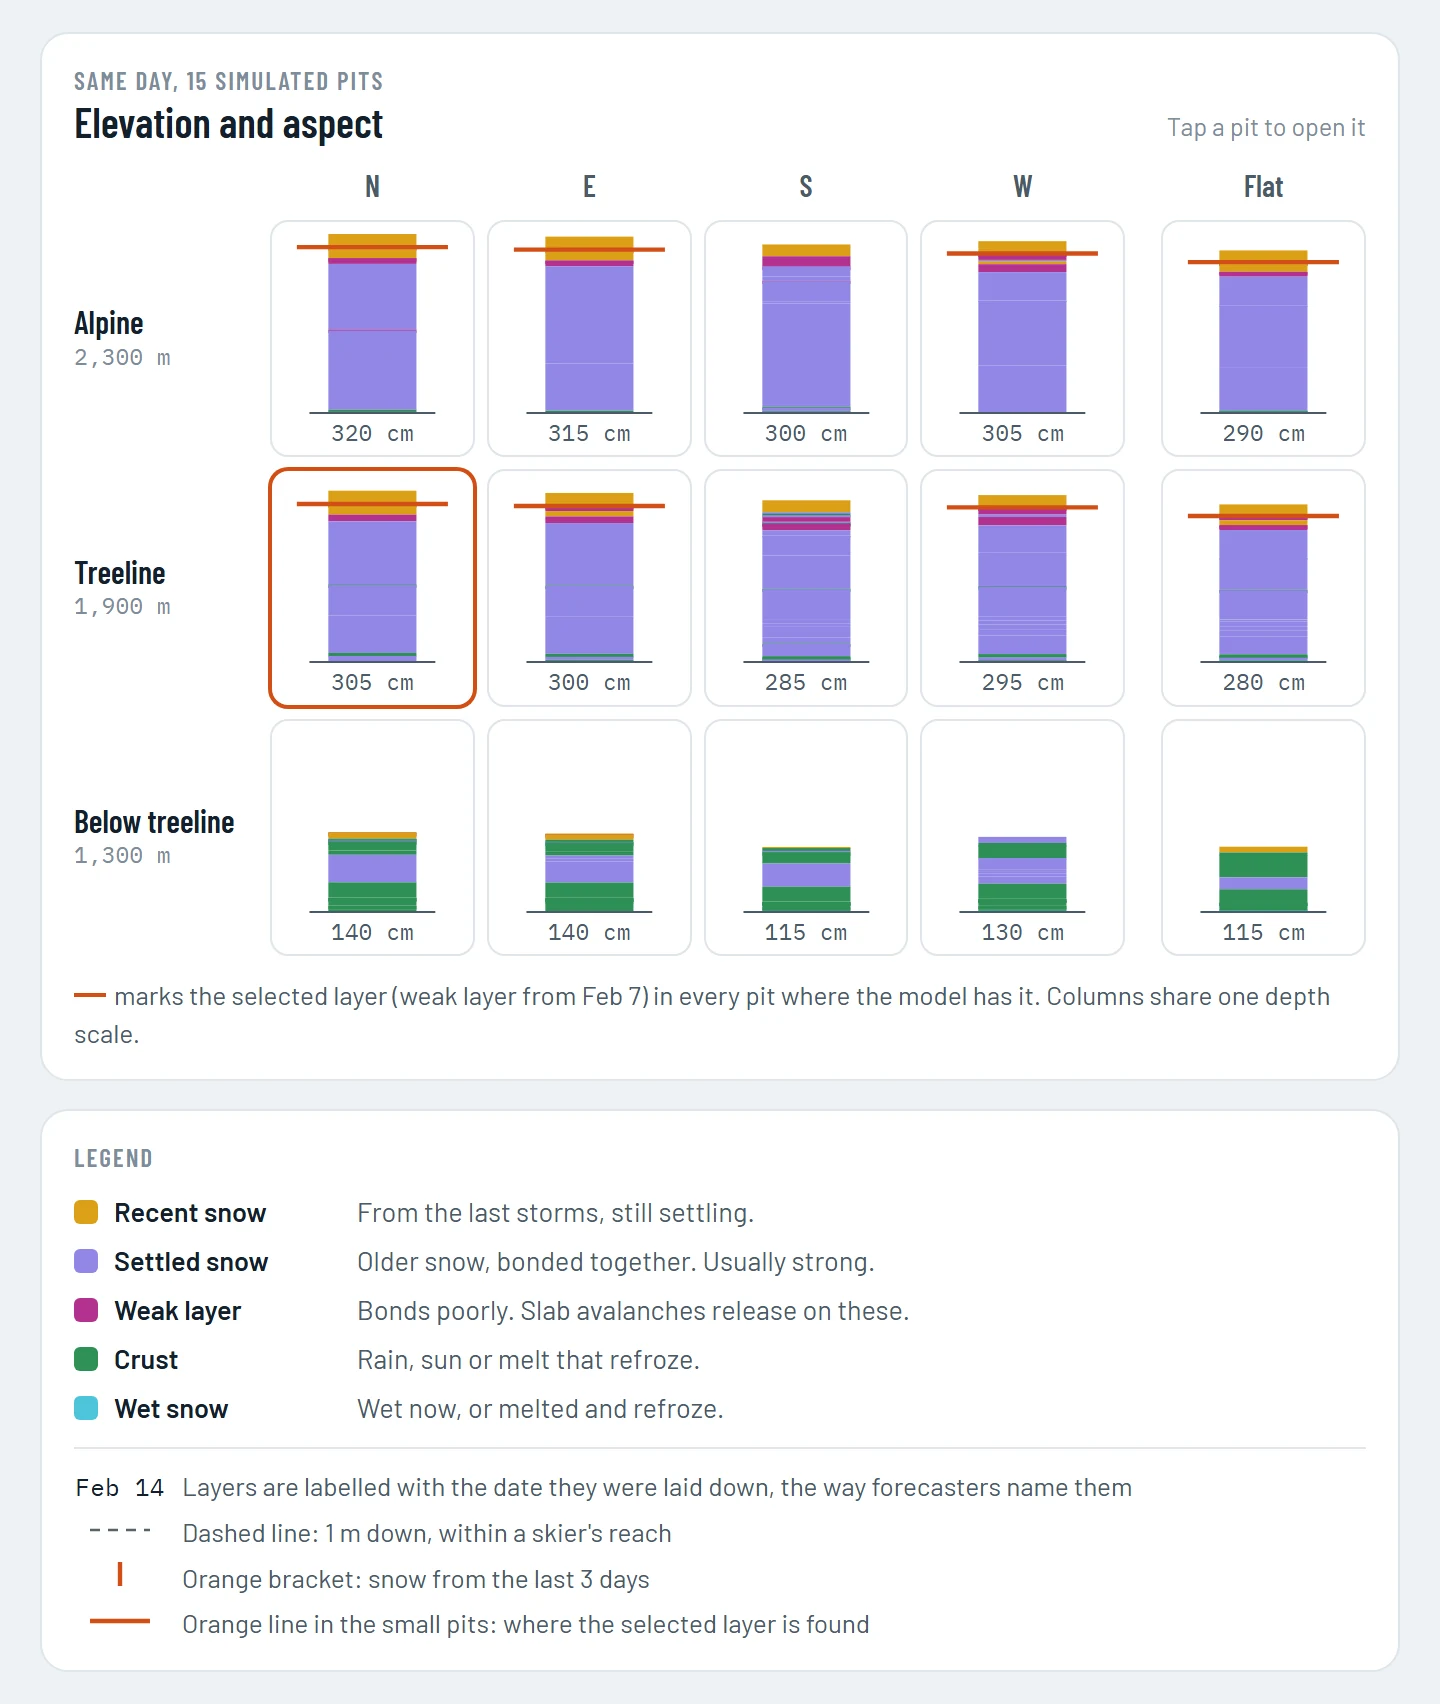
- Elevation and aspect: 15 small pits, three heights by flat ground and four aspects, with the selected layer marked wherever the model has it.
- Colours mean the kind of snow, not danger: recent snow light blue, settled sand, weak layers deep magenta, crusts near-black brown, wet snow teal.
- A place is simulated when someone opens it; after that, each day adds that day's weather.
Region snowpacks
A region is too big for one column, so its snowpack is built from the same five neighbourhoods as its weather (see Regions and heights).
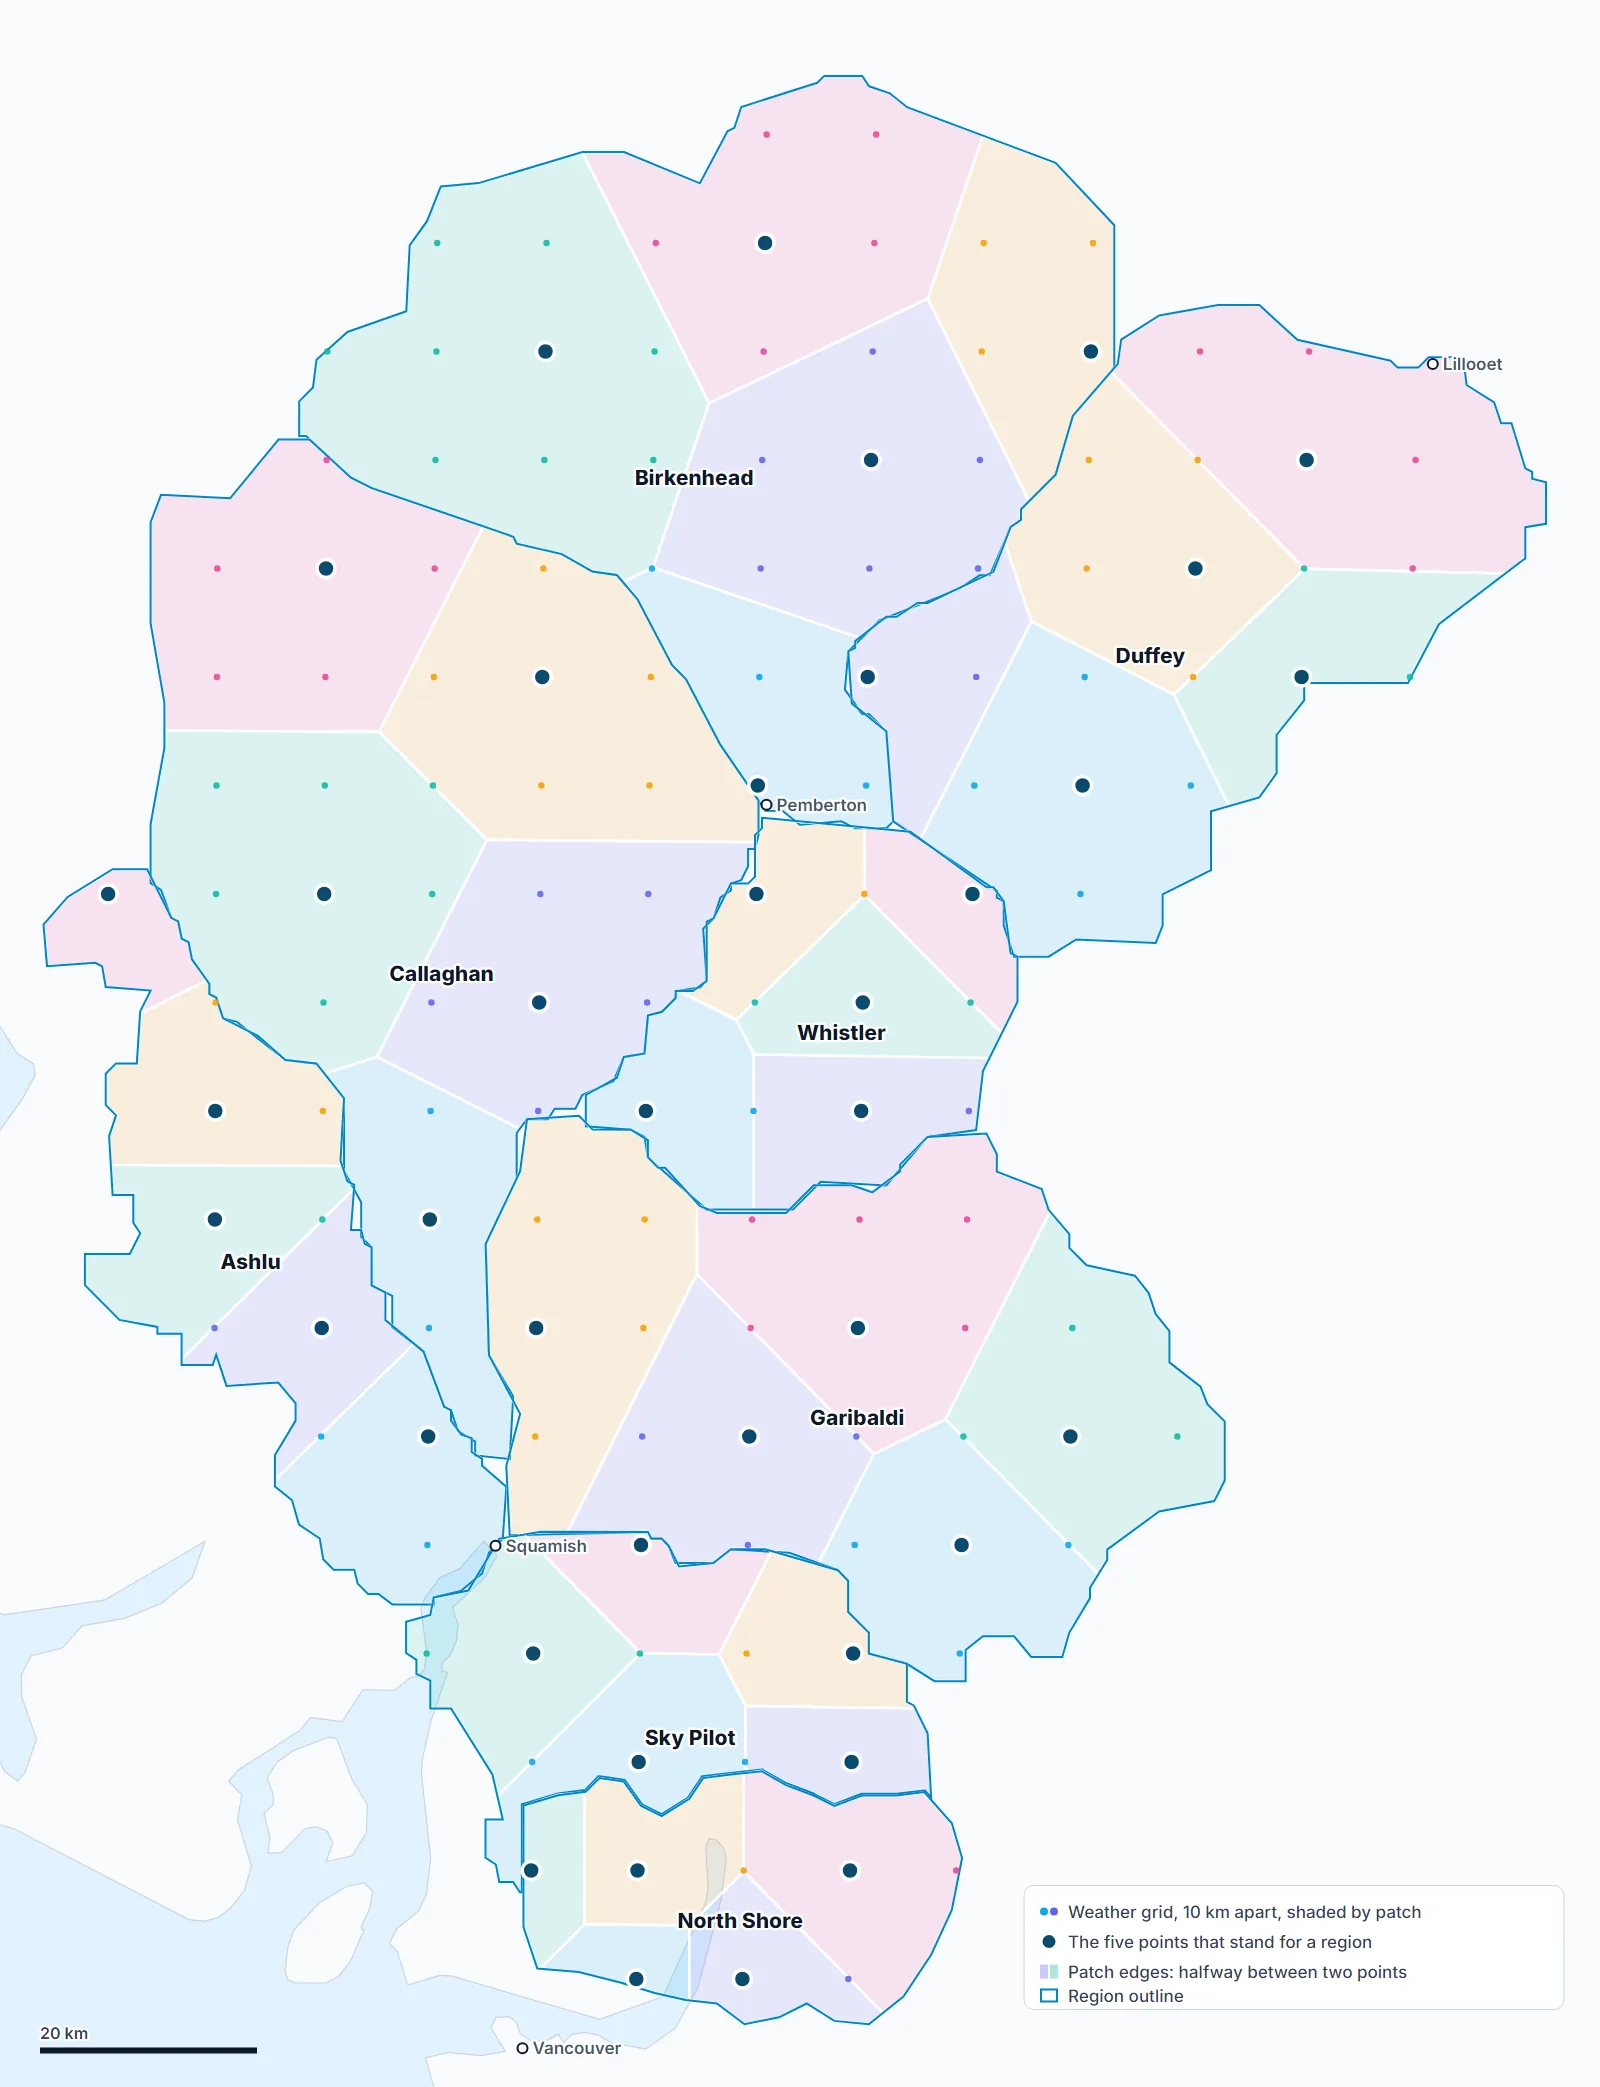
- Main pit: the five points' weather, averaged by each neighbourhood's share, simulated on flat ground and four 38° slopes at the region's three heights.
- Five point pits: each point simulated on its own, on flat ground at all three heights, from the weather already downloaded for the average.
- Simple view gives depth as a range across the points ("300 to 325 cm of snow") and says which points hold each buried layer ("at points 1, 2, 3 and 4 of 5").
- Detailed view draws the five pits side by side under the map, numbered west to east like its pins, with the tapped layer outlined in each.
- Doctor's Orders reads the same counts, so the report can say a layer turned up at four of five points rather than everywhere.
- The averaged pit shows first; the five points fill in after it.
The weather is averaged, not the pits. An average of a pit with buried frost 40 cm down and one without would be a pit that exists nowhere, so the points are counted instead. The five point pits show whether a layer is region-wide or patchy: a storm or a cold clear spell on one corner can blur in the average.
Testing
The 2025-26 winter (October 1 to May 31) replayed: 145 full-season simulations at 22 locations, more than 20 combinations of settings and inputs, scored by written rules.
| Check | Result |
|---|---|
| Weak layers named in 23 Glacier National Park bulletins | 5 of 5, on the right dates |
| Crusts named in those bulletins (35 cases) | 27 found as crusts, 7 more as a weak layer at that spot, 1 missed |
| Layers labelled in Avalanche Canada's simulated profiles (70, at 7 locations, 4 snow climates) | 61 present on the right dates |
| Grain type of those layers | About half exact; ours usually starts to round sooner |
| Rockies (Mount Whymper) | Every labelled layer, grain type included |
| Snow depth against those profiles | About 10% shallower |
A layer counted as found only if it formed within 4 days of the named date under at least 5 cm of stronger snow; a crust only within 5 cm of where the surface was when it formed.
What testing changed
| Problem | Fix |
|---|---|
| Snow surface too cold on clear nights; no buried surface hoar | Clear-sky longwave formula (Prata 1996), a small calibrated offset, SLF's neutral exchange setting |
| 12 of 22 treeline crusts missed | Rain or snow from HRDPS's air aloft at the spot's height |
| No sun crusts on south slopes | SLF's ageing snow reflectivity (Schmucki et al. 2014) |
| Grid points in valleys read too dry | Weather kept at each region's three heights |
| Snow kept where Sea to Sky snow pillows measured rain (November 2026) | Rain or snow from temperature and humidity: about +0.6°C in storm air, was +1.25°C. Ten Sea to Sky stations: snow depth off by 6 cm on average, was 9; last season's tests unchanged |
| Thin October snowpacks stopped the run on mild evenings | 5-minute steps (from 15); every calibration test re-passed |
Snow amounts
Against 85 BC River Forecast Centre snow pillows, the model gets a winter's snow about right on average, but at one spot it's typically about 25% off, sometimes double. Nearby stations don't fix it: two stations 25 km apart disagree with the model about as much as two 200 km apart. So the tab leads with layer dates, which are far more reliable than amounts.
Limitations
- Wind at the scale of your slope: it knows which aspects face the wind, not the cross-loaded gully or cornice.
- Local variation: one column stands for an area.
- Storms the weather model got wrong: a missed rain event is a missed crust.
- Sun crusts on very cold, clear days near the solstice.
- Heavy spring rain on deep coastal snowpacks soaks deeper than observed.
- Depth after warm rain, most on the coast. After the November 2026 atmospheric river it read about 25 cm at 1,400 to 1,500 m on the coast where the ground was bare (Tetrahedron, Red Heather). The weather model puts too much water on the coast mountains, and warm rain melts our snow too slowly. After 20 mm of rain in 3 days the depth carries a "may read high" flag.
References
- Bartelt, P., and M. Lehning (2002). A physical SNOWPACK model for the Swiss avalanche warning. Part I. Cold Regions Science and Technology 35(3), 123-145.
- Lehning, M., et al. (2002). Part II: snow microstructure. Cold Regions Science and Technology 35(3), 147-167.
- Lehning, M., et al. (2002). Part III: meteorological forcing, thin layer formation and evaluation. Cold Regions Science and Technology 35(3), 169-184.
- Fierz, C., et al. (2009). The International Classification for Seasonal Snow on the Ground. UNESCO-IHP.
- Schmucki, E., et al. (2014). Cold Regions Science and Technology 99, 27-37.
- Prata, A. J. (1996). Quarterly Journal of the Royal Meteorological Society 122, 1127-1151.
- Milbrandt, J. A., et al. (2016). The Pan-Canadian High Resolution (2.5 km) Deterministic Prediction System. Weather and Forecasting 31, 1791-1816.
Something here wrong or unclear? Write to hello@snowdoctor.ca.